Stack Frames
Each Thread of a Debug Session will usually have one or more Stack Frames.
The stack keeps track of the execution flow of your program; each time one method calls another, the current Execution Point is added to the stack, so that when the method is finished, it can return execution to where it was called from. As your application does its job, the call stack grows.
Each stack frame also keeps track of the current state of the program at the time, including values of local variables and the like. In the debugger, you can examine each stack frame individually, to see how your program got to its current state.
A stack frame will be shown in black color in the Threads and Callstacks pane if Debug Symbols are available for it (which usually means it is a location in your own code), or in a lighter gray if not (usually a sign that it's in library or system code).
To make it easy for you to find the most relevant stack frame for you when an application pauses, the top stack frame that has debug symbols is highlighted in blue text (and selected by default). This way, even when your application stops deep in system code, you can easily find the place where your code called into the system APIs.
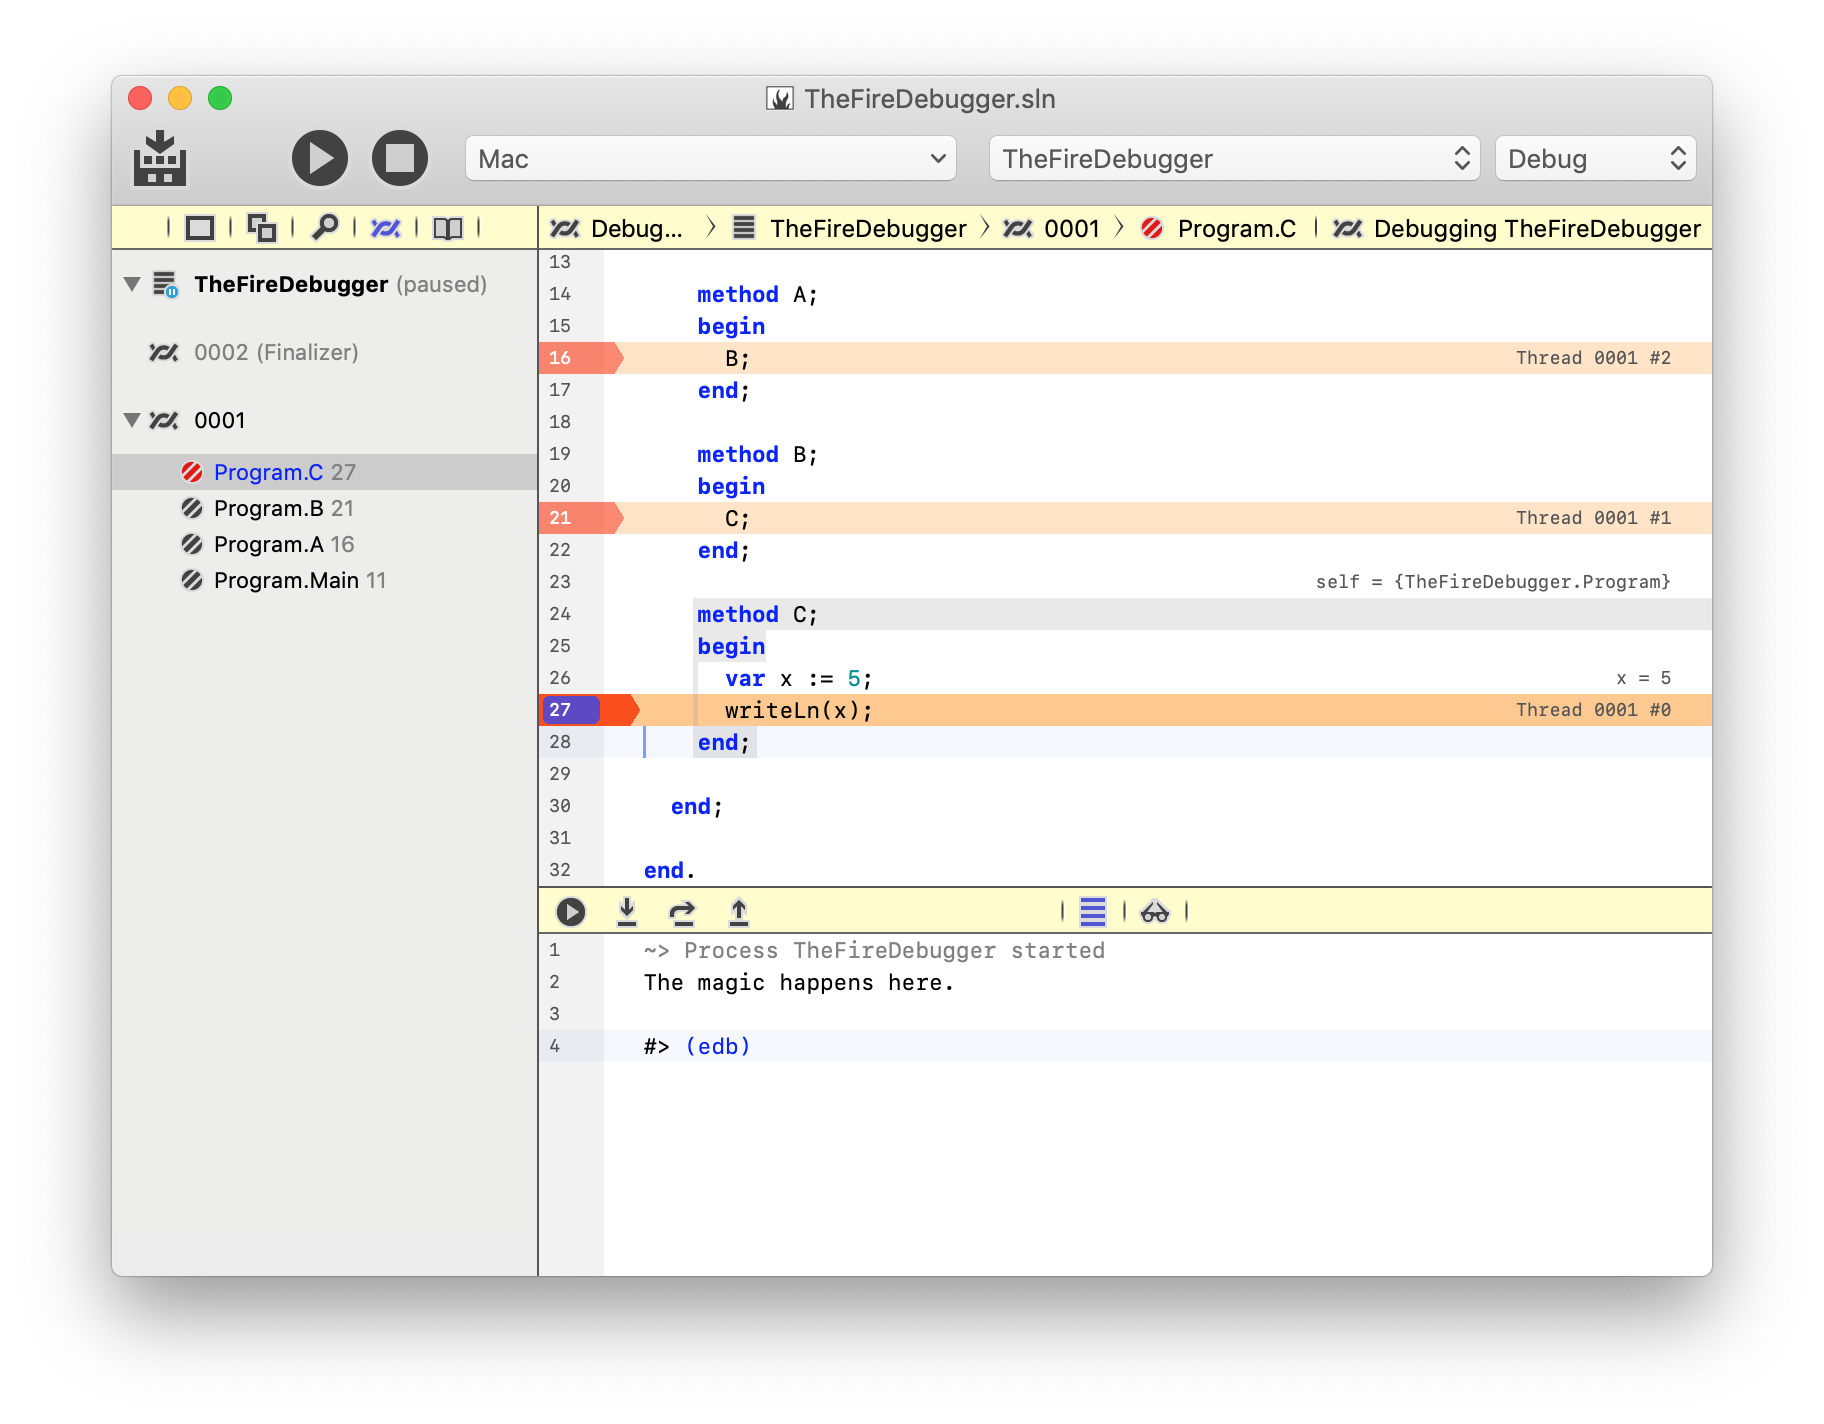
In the above screenshot, the main thread of the application is paused four methods deep. In this case, all four stack frames are application code, so they all show black, and the very top frame shows blue because it's the most relevant frame to why the application paused (on Breakpoint in the "Program.C" method).
You can see Execution Points highlighted in the Editor
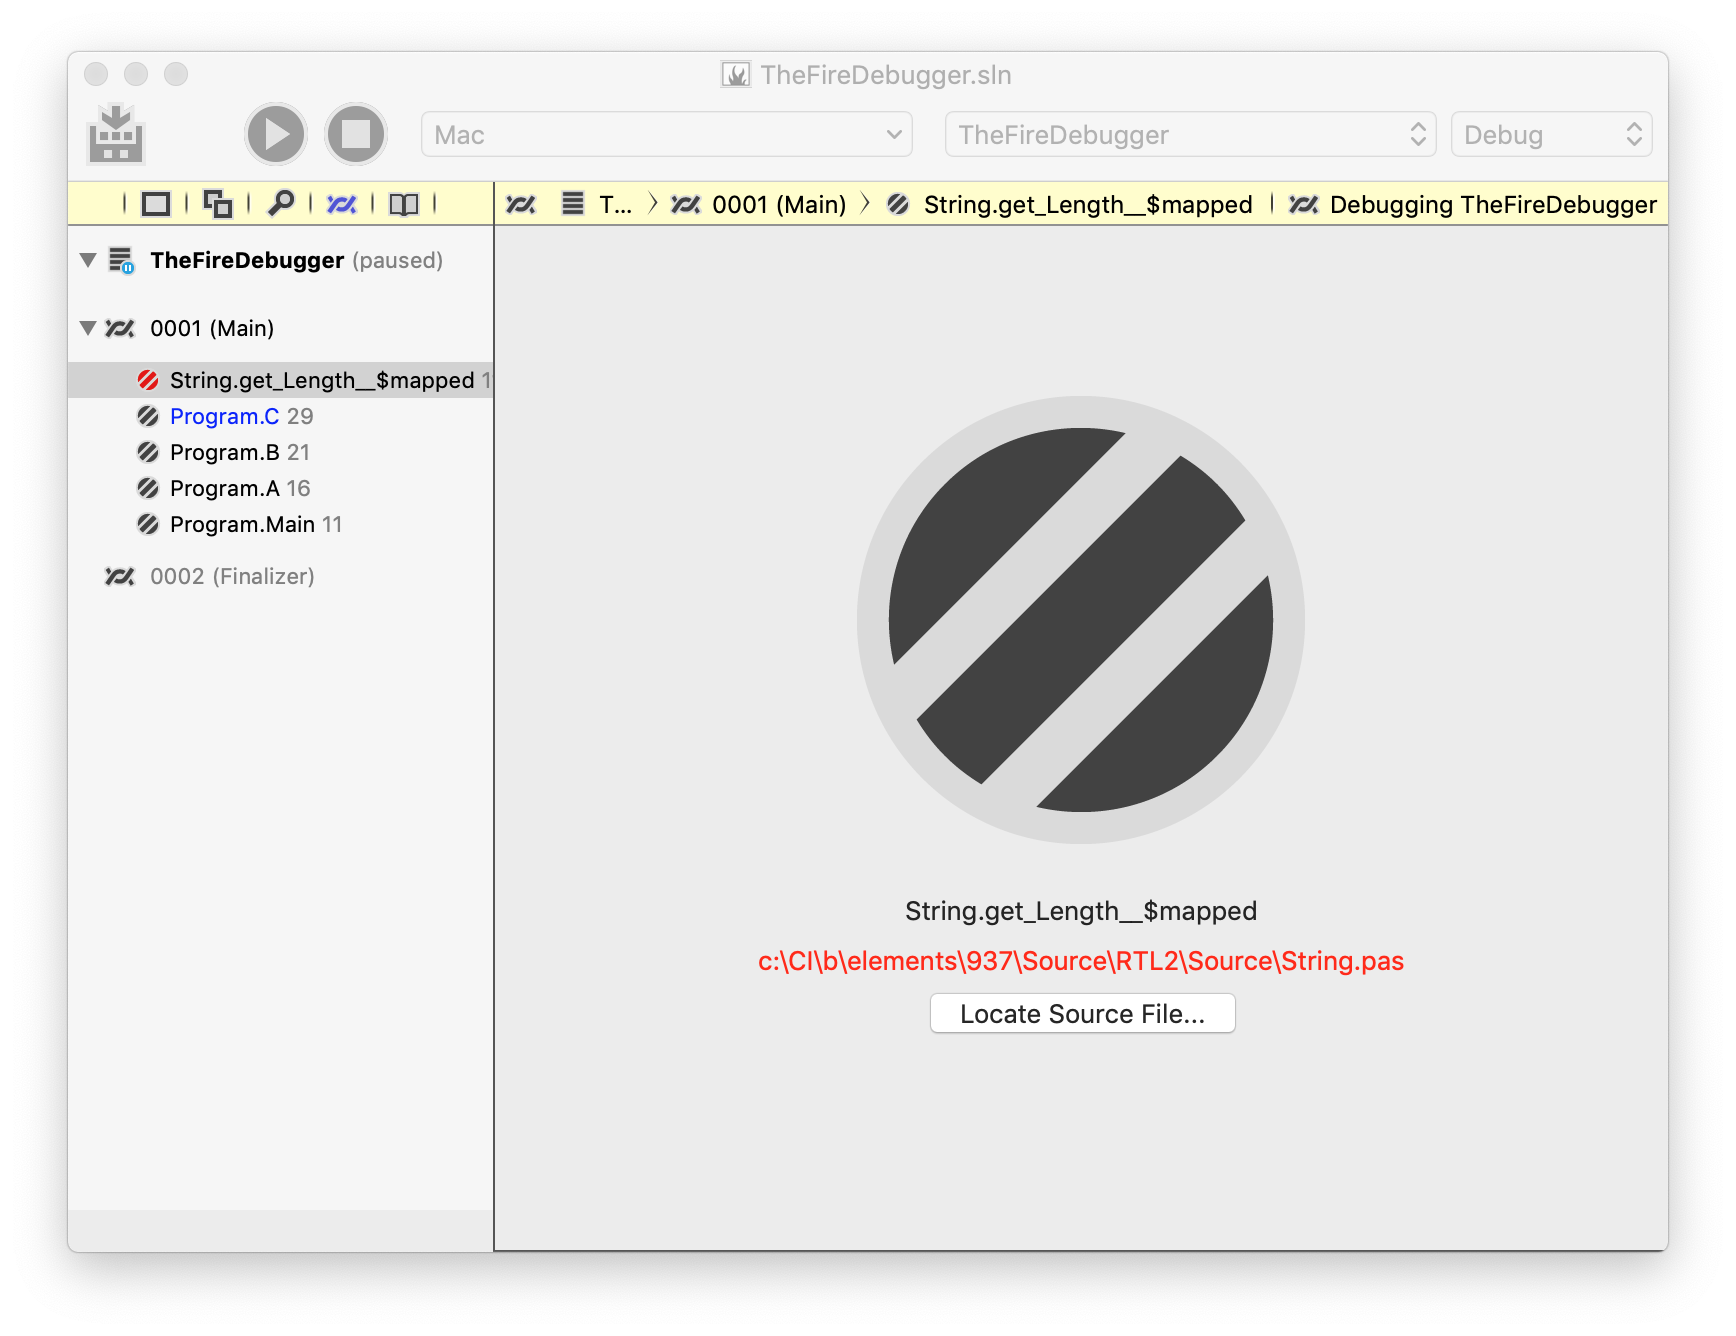
In this second example, the application stopped on an Exception in a library function, where source is not available. Instead of the code editor, a special Stack Frame view is shown with details.
Note how Program.C is still the stack frame highlighted in blue (because it will be the most relevant for investigating the exception). In fact, that stack frame was also selected by default when the application stopped, and String.get_Length__$mapped was selected manually before the screenshot was taken.
Note also that in this case, while source code for the method in question was not found, the library was compiled with Debug Symbols – it is just that the file name in the symbols does not match what we have on the local disk (the library in question is Elements RTL, and from the file path we can see that it was build on the RemObjects CI system as part of the Elements distribution).
Because the stack frame has debug symbols and a known file name and location (String.pas, line 116), the option is provided to "Locate Source File..".
If you happen to have source code for the library (in this case, you could get a copy of Elements RTL from GitHub, you could browse for where your local copy of String.pas is on your disk, and then view the source, set additional breakpoints, and more.
For platforms that support it, an additional option will be available to see the assembly code for the method in question:
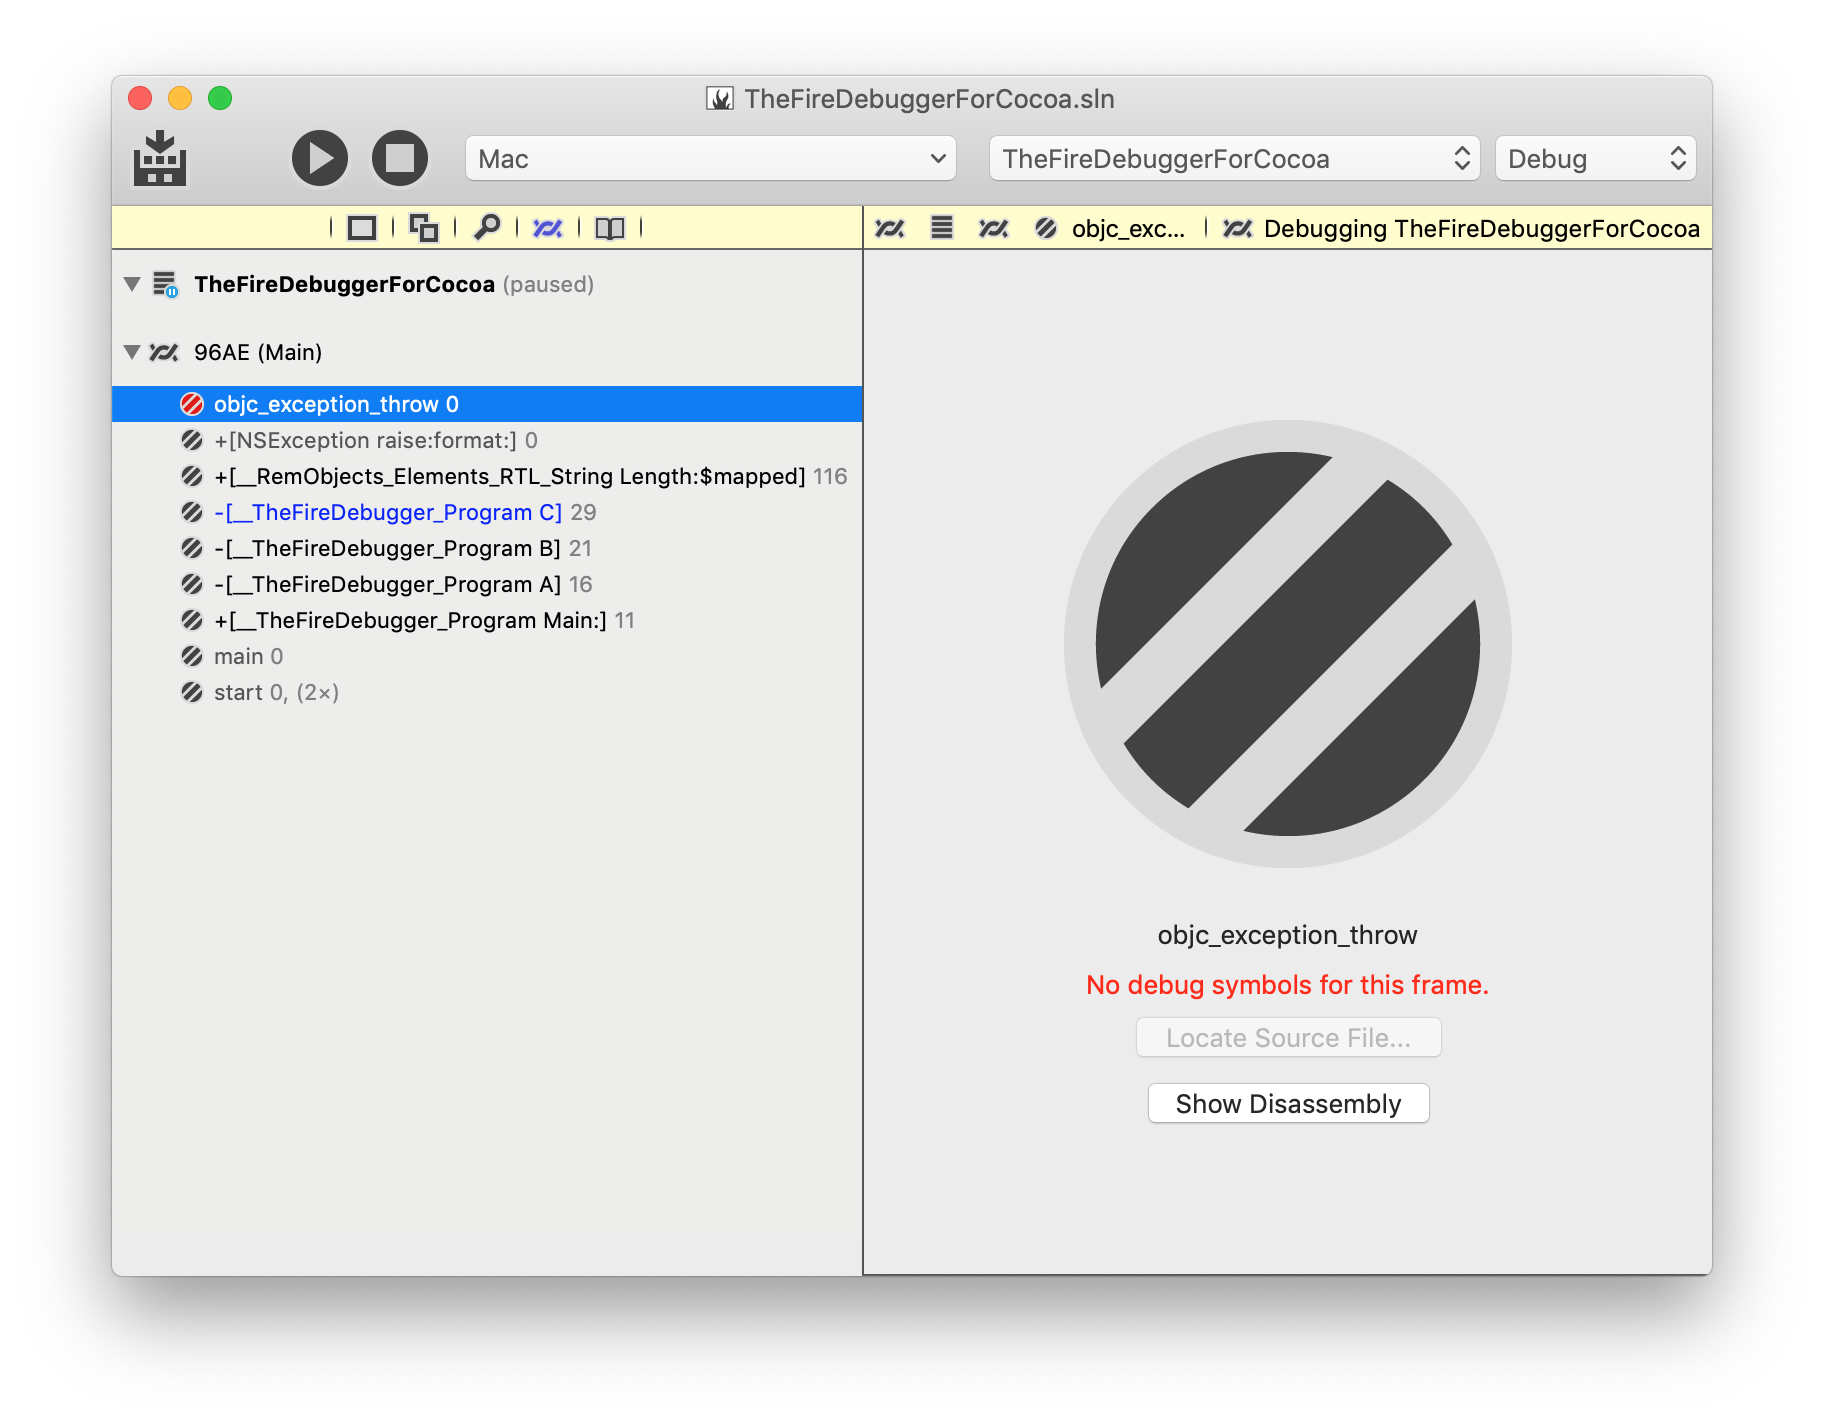
This screenshot shows a similar exception as earlier, but in the Cocoa project. Two things of interest can be seen here:
For one, the "Show Disassembly" button becomes available; clicking it will switch the view to show the low-level Assembly Code for the method. For another, you see that in the case of Cocoa a few extra system stack frames are on the stack, both before the Main and at the place where the exception occurred. Because no debug symbols are available for these frames, they show in gray, and the Locate Source File.. button is disabled.
Note how +[__RemObjects_Elements_RTL_String Length:$mapped] still shows black (but not blue) because it has symbols, but no source code was found, just as in the case with the .NET project earlier.
Disassembly is available for Cocoa and Island.
Recursion
The debugger automatically detects recursions, whether intentional or when your application crashes with a Stack Overflow. Instead of showing you hundreds (or tens of thousands, as might be the case for a stack overflow) of the same stack frame, it will collapse them to a single entry and show (999×) behind the frame, if it ran 999 times.
See Also
- Threads
- Execution Points
- Debug Symbols
- Threads and Callstacks Pane
- Disassembly