Threads and Callstacks Pane
The "Threads and Callstacks" Pane is the fourth tab of of the Navigation Pane that makes up the left side of the Fire/Water user interface.
It can be reached by clicking the thread button at the top, via the ⌘4 or Ctrl+4 keyboard shortcut, or by selecting "View|Show Threads and Callstacks" from the menu. By default, it will also automatically show when a Debug Session breaks and pauses the execution of your app.
The pane is your one-stop place for navigating around the current state of your debug session. It shows you a tree hierarchy of all active Debug Sessions (usually only one), as well as – when the debug session is paused – all the active threads and all their stack frames:
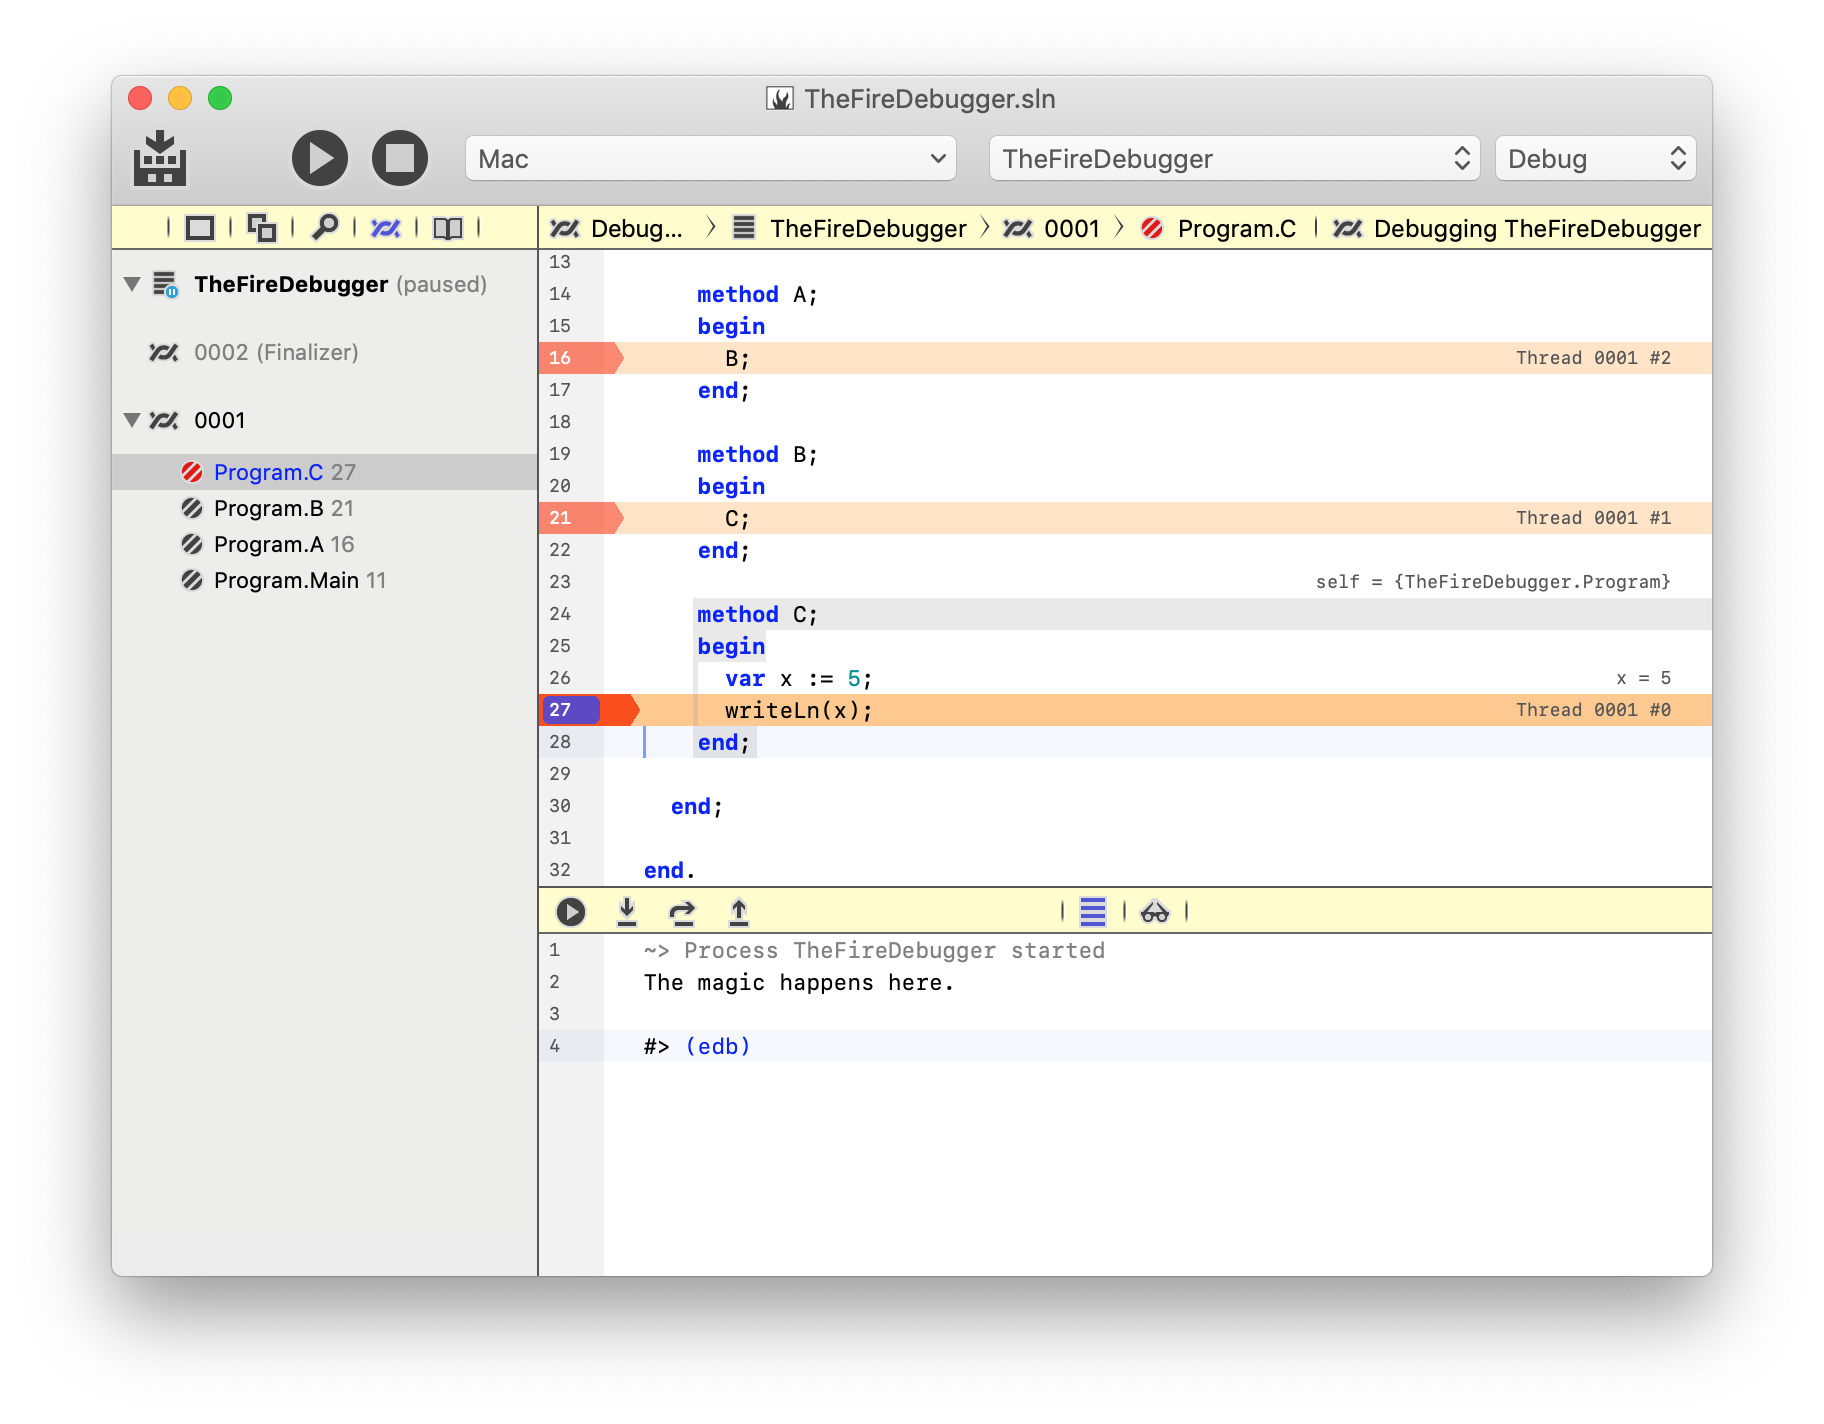
Above you see a .NET application being debugged in Fire, it is stopped on a Breakpoint on line 27, indicated by the blue breakpoint bubble, and the darker orange Execution Point highlight across the line. The thread pane is active on the left-hand side, it shows a single Debug Session, with the name of the app being debugged ("TheFireDebugger") and the current status ("paused"). Below, you see two Threads, one called "Finalizer" which is implicitly created for each .NET application, and the (unnamed) main thread of your app, numbered "0001".
For the main thread, you see four Stack Frames. Top to bottom, you see the execution flow that this thread went through to reach the current location, with the top frame at the top (method "C" with the breakpoint, and the application's entry point, Main at the bottom).
The coloring of each frame gives you additional information about its status:
-
The top frame with debug symbols is colored blue, as this is likely the most relevant frame for your investigation. In this example, it is the very top frame, because the debugger stopped on a breakpoint in your own code. But one can imagine a case where application code called into a system library and that library raised an exception. The call stack would list all the stack frames, even those within the system libraries – but the blue frame would indicate the top frame from "your code".
-
Frames without Debug Symbols will be colored light or dark gray, depending on whether they have at least a known function name associated with them (dark gray) or are completely unknown (light gray). Most likely, these are stack frames of system code.
-
Finally, frames with debug symbols are colored black. Most likely, these are the frames in your own application, but they could also be stack frames from other libraries that you have debug symbols and source code for.
Browsing between Stack Frames
The "current" stack frame is highlighted by the selection in the tree and – more importantly – by a red (instead of black) icon. This is the stack frame that debugger interactions work on, for example when you evaluate the contents of variables in the Debug Inspector.
You can select a different frame just by clicking it, or by using Up/Down Navigation (^⌥Up/Down in Fire, Alt+Up/Down in Water). As you select a different frame, you will see the rest of the UI adapt – the code editor will jump to the proper location for the newly selected frame (assuming it has source code associated with it), and the orange Execution Point highlight will change. Also, inline debug evaluation is shown in the editor, and the contents of the Debug Inspector will change as well.
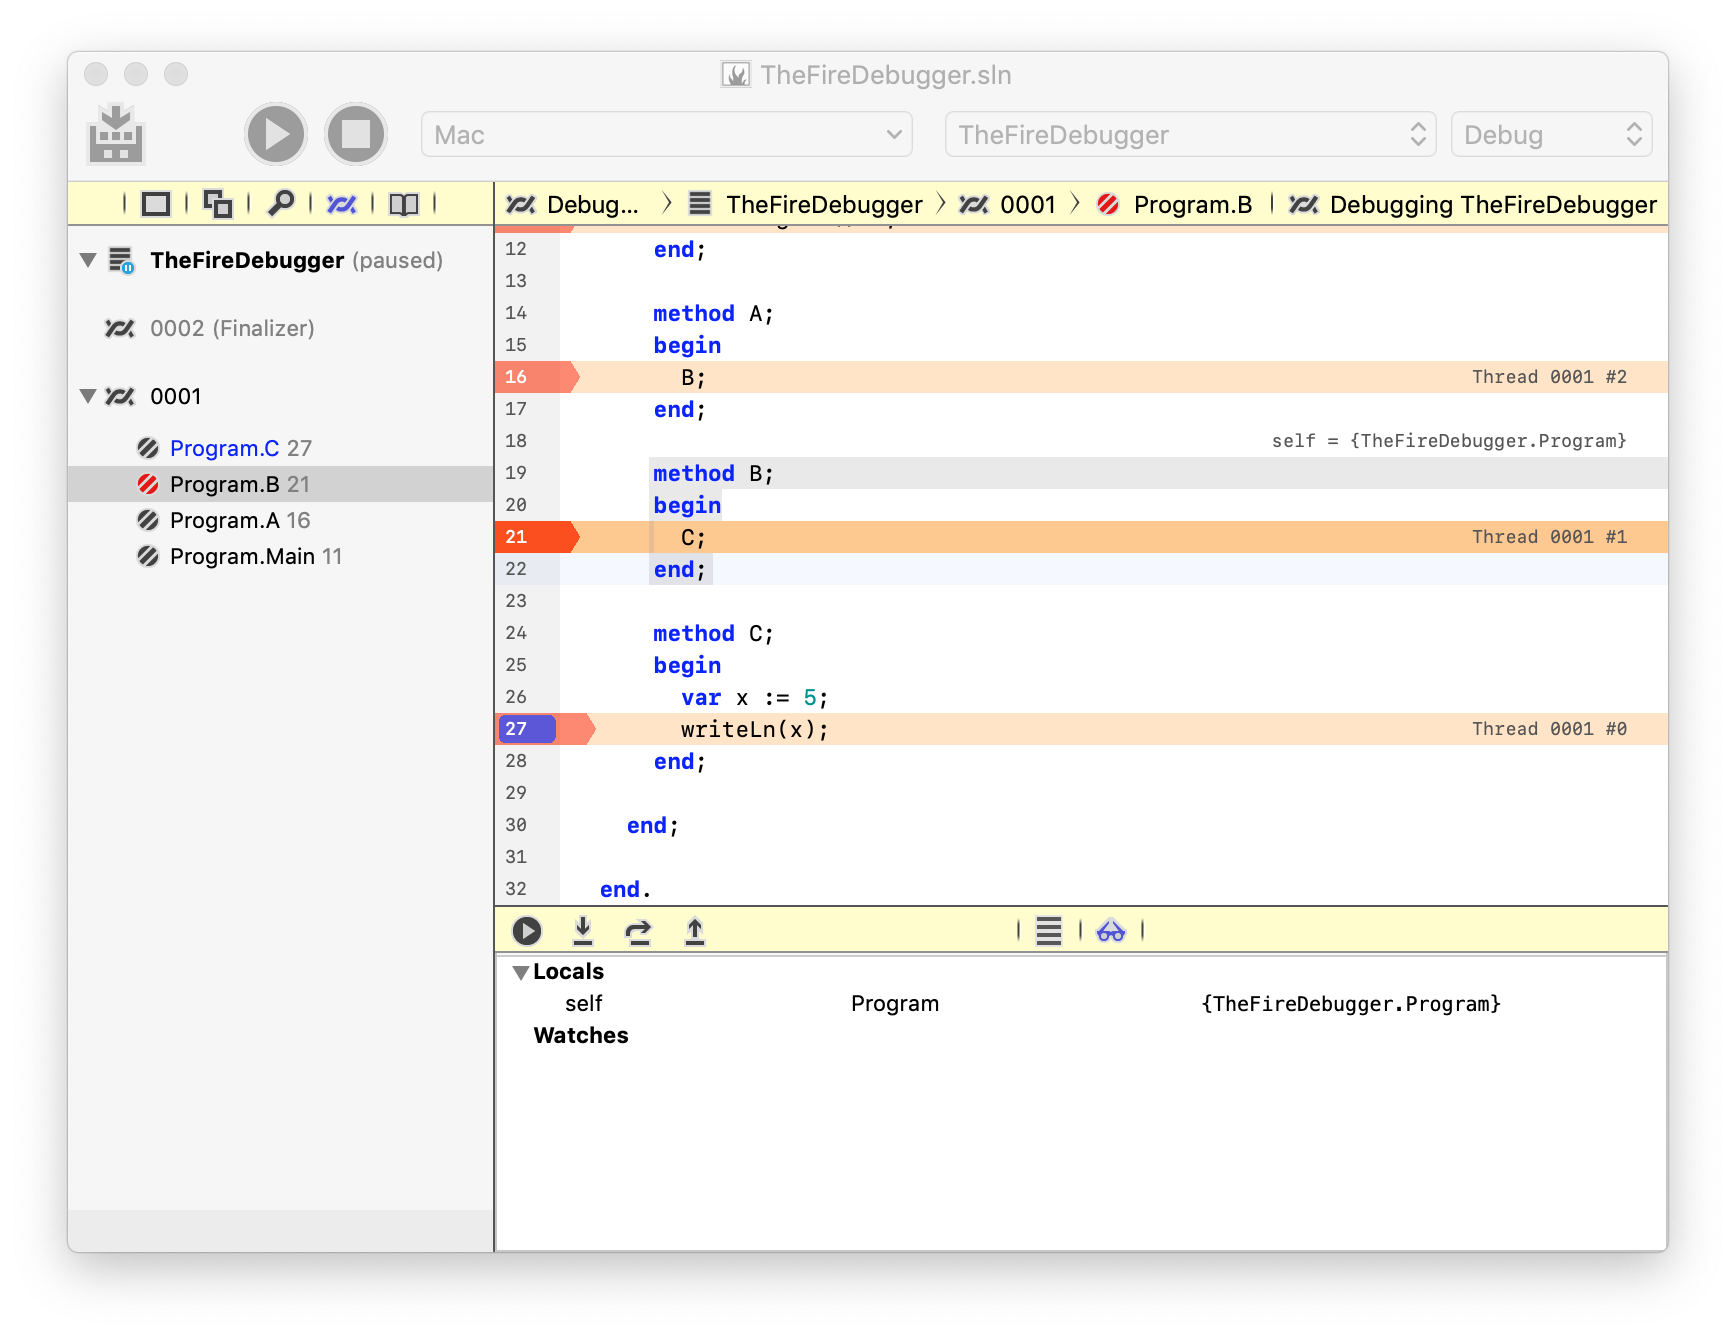
In the above screenshot, stack frame "Program.B" was selected. Note how it now has the red icon, and how the execution point highlight on line 21 is now deep orange. Also, the inline evaluation for x and self on method C have disappeared in the editor, and instead it now shows an inline evaluation for self on method B instead (which has no other variables).