Debug Sessions
A Debug Session refers to a single running instance of your project being debugged in the debugger. While in theory Fire and Water can manage multiple debug sessions at the same time, in most cases you will have either zero or one debug session active.
A debug session can be started either by Choosing "Run" from the menu (⌘R or Ctrl+R), or by Attaching to an already running process via the "Debug|Attach to Process..." menu.
A debug session can be stopped by choosing ""Stop" from the menu, pressing ⌘. or Ctrl+., or right-clicking the debug session's node in the Threads and Callstacks pane and choosing "Stop" or "Detach". Running an app again while a debug session is active will also terminate the active debug session for it.
The Jump Bar and the toolbar of the Debug Pane will show in yellow when one or more debug sessions are active (unless a Build is also underway, in which case the Jump Bar will show blue to indicate that).
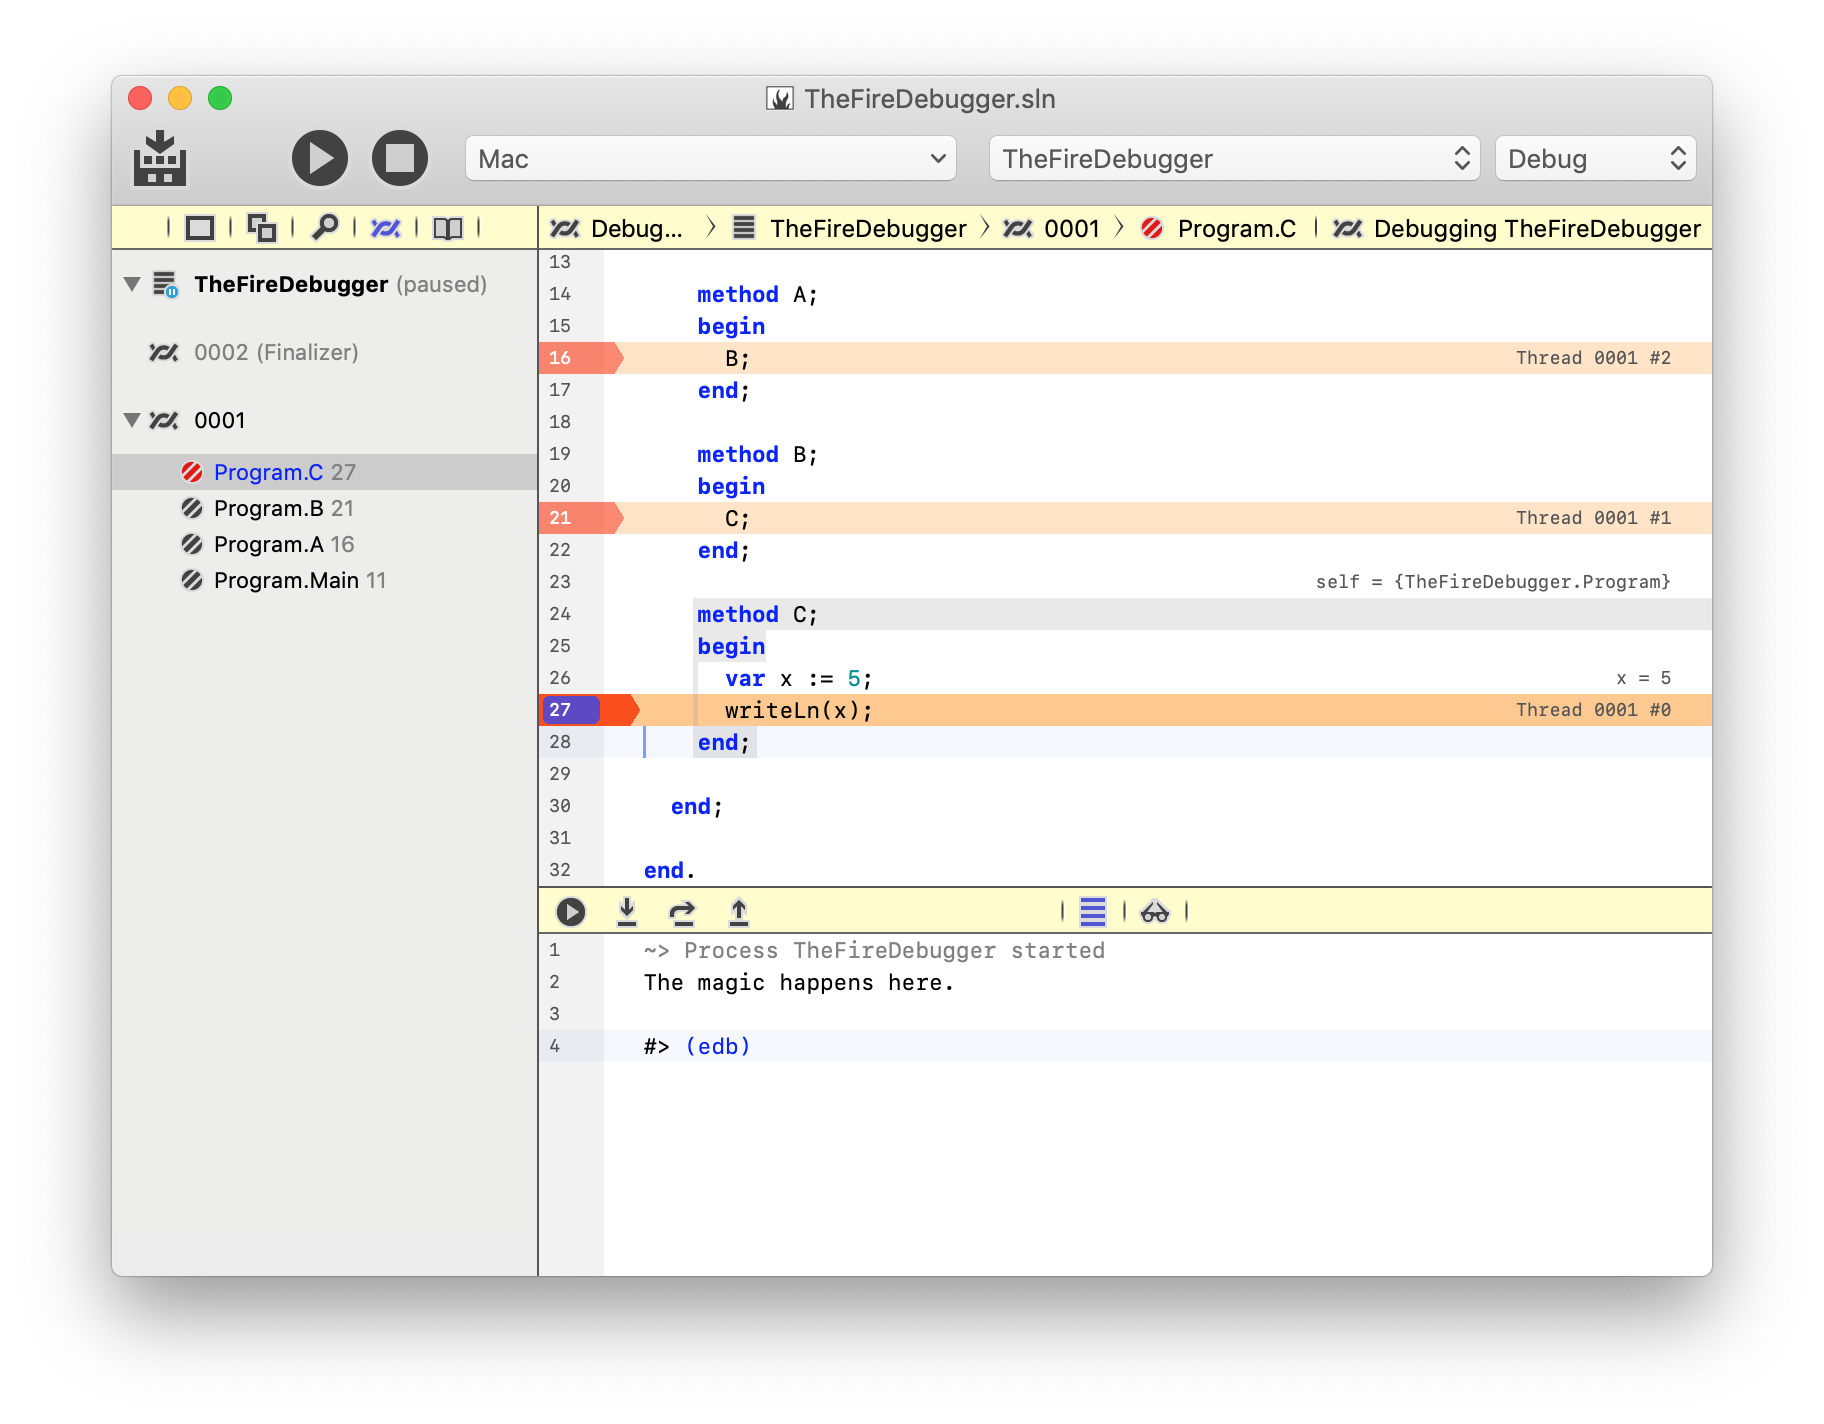
In the above screenshot, a single Debug Session for the application named "TheFireDebugger is active, currently paused on a Breakpoint.