Debugging in the Code Editor
The Code Editor integrates with the debug engines in Fire and Water in several ways, to allow you to accomplish debugging tasks directly within your code.
Breakpoints
- Breakpoints can be set and removed by clicking on the line numbers in the editor (or clicking close to the left edge of the window, kif you have disabled line n numbers in Preferences.
- Breakpoints can also be added, removed and edited by right-clicking or Control-clicking onto the line number or near the lefthand gutter.
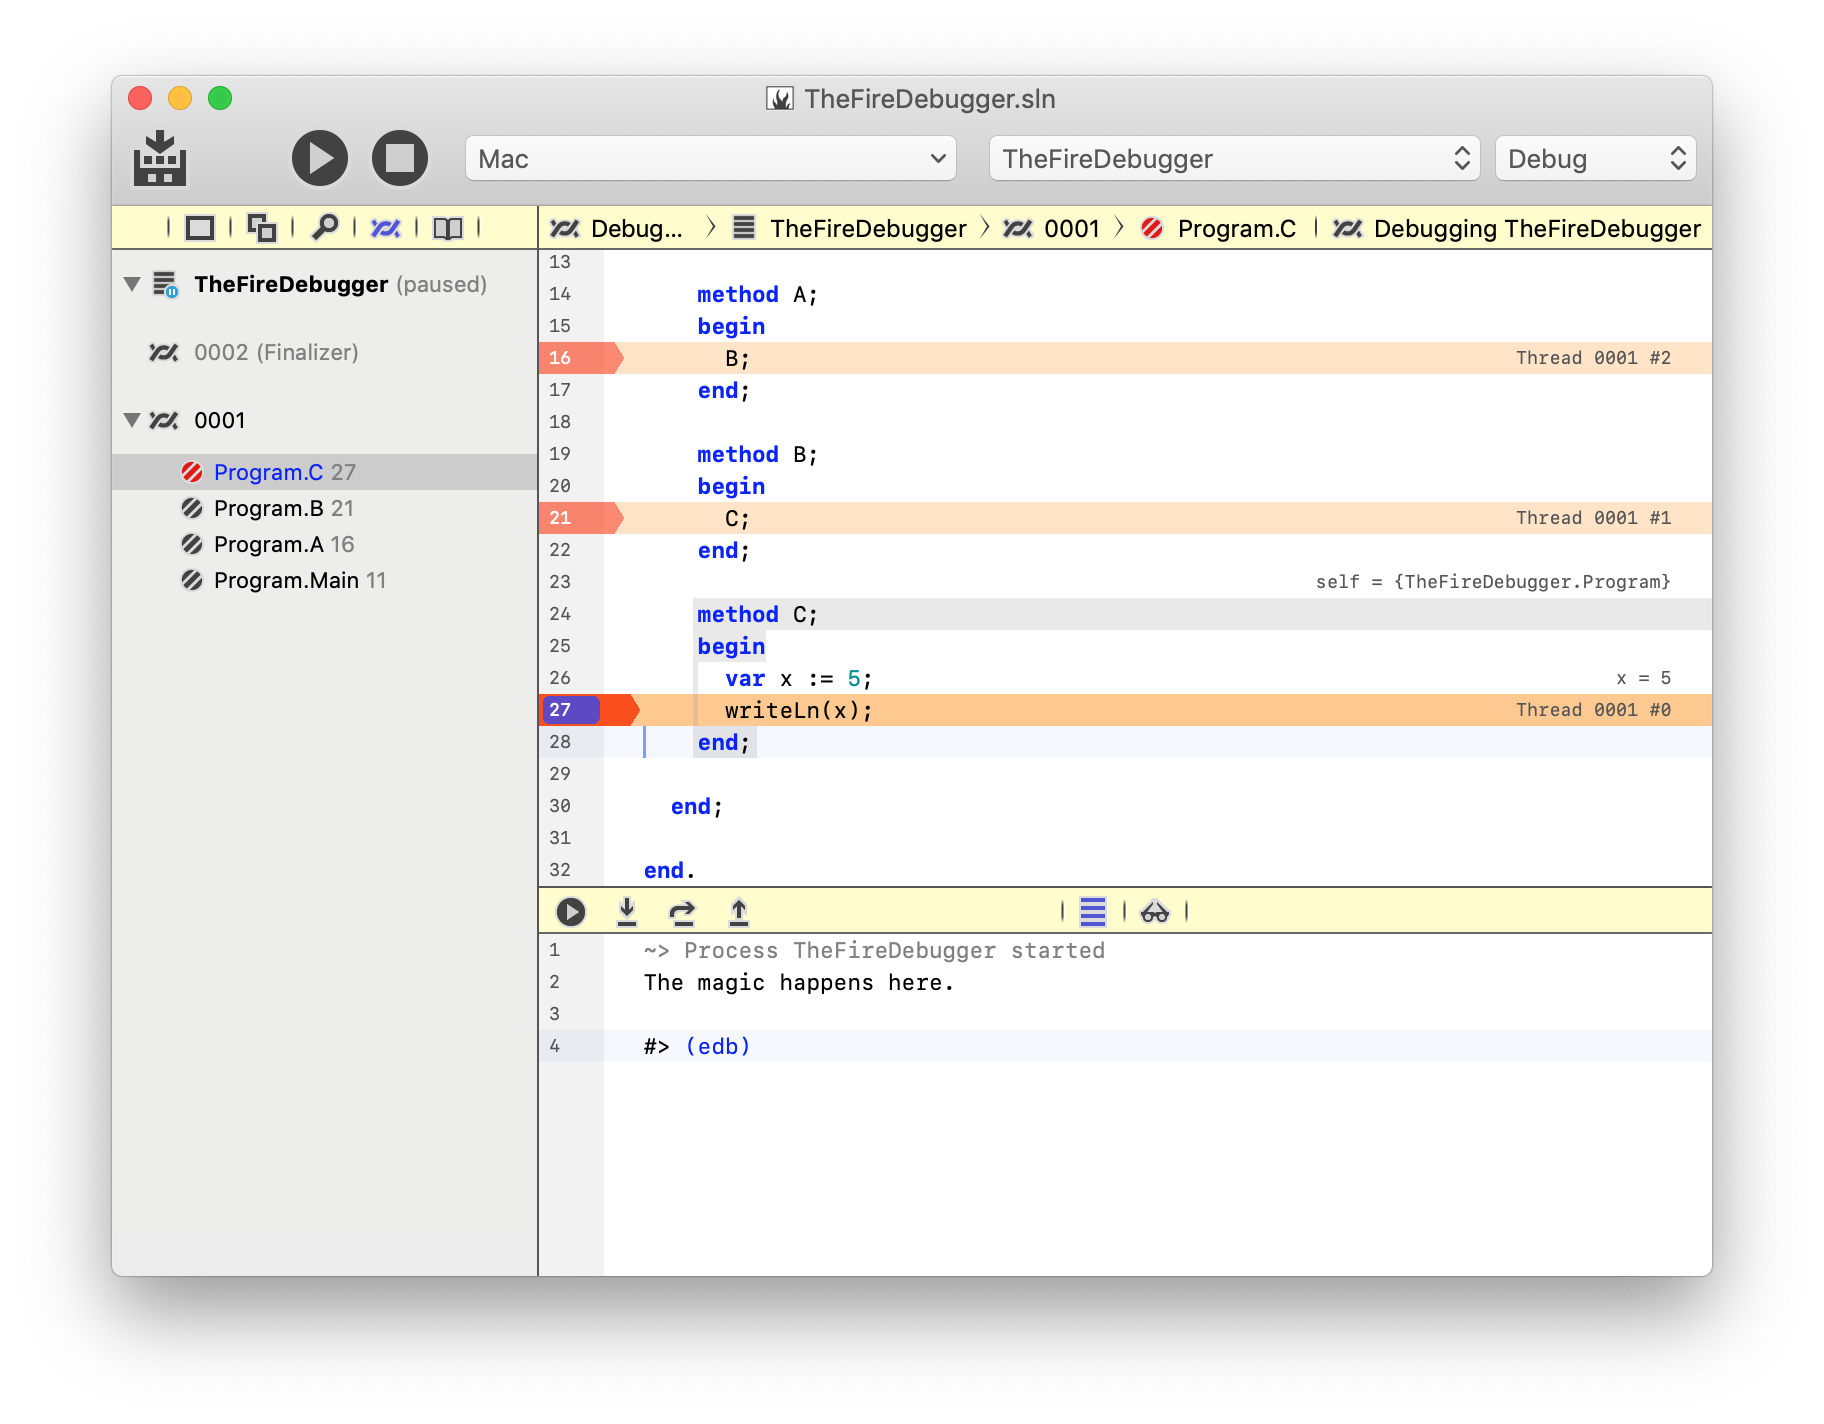
Once set, breakpoints will show as small bubbles over the line number or as nubs on the left side of the editor, for each line. Thye will be color-coded for status:
- Blue indicates an resolved and active breakpoint, or any breakpoint when no debug session is active.
- Red indicates an unresolved breakpoint in an active debug session. This could mean a breakpoint on a line that has no valid code or has no debug symbols, or a breakpoint in code that simle has not been loaded into memory yet (but will resolve once execution nears it)
- Gray indicates a disabled breakpoint that will be ignored.
If "Stop on Breakpoints" is disabled in the "Debug" menu, all breakpoints will show as gray.
Stack Frames
When execution of your project is paused, an orange highlight will be drawn across each line representing an active Stack Frame; the selected stack frame will be highlighted in a deeper color. The highlight includes the Thread name/id and the index of the stack frame, on the right edge of the editor.
In most cases, as in the screenshot below, you will only see a single frame in view, but if methods that call each other are located in close proximity to each other, you may additional frames below or above your current execution point highlighted as well.
Inline Locals
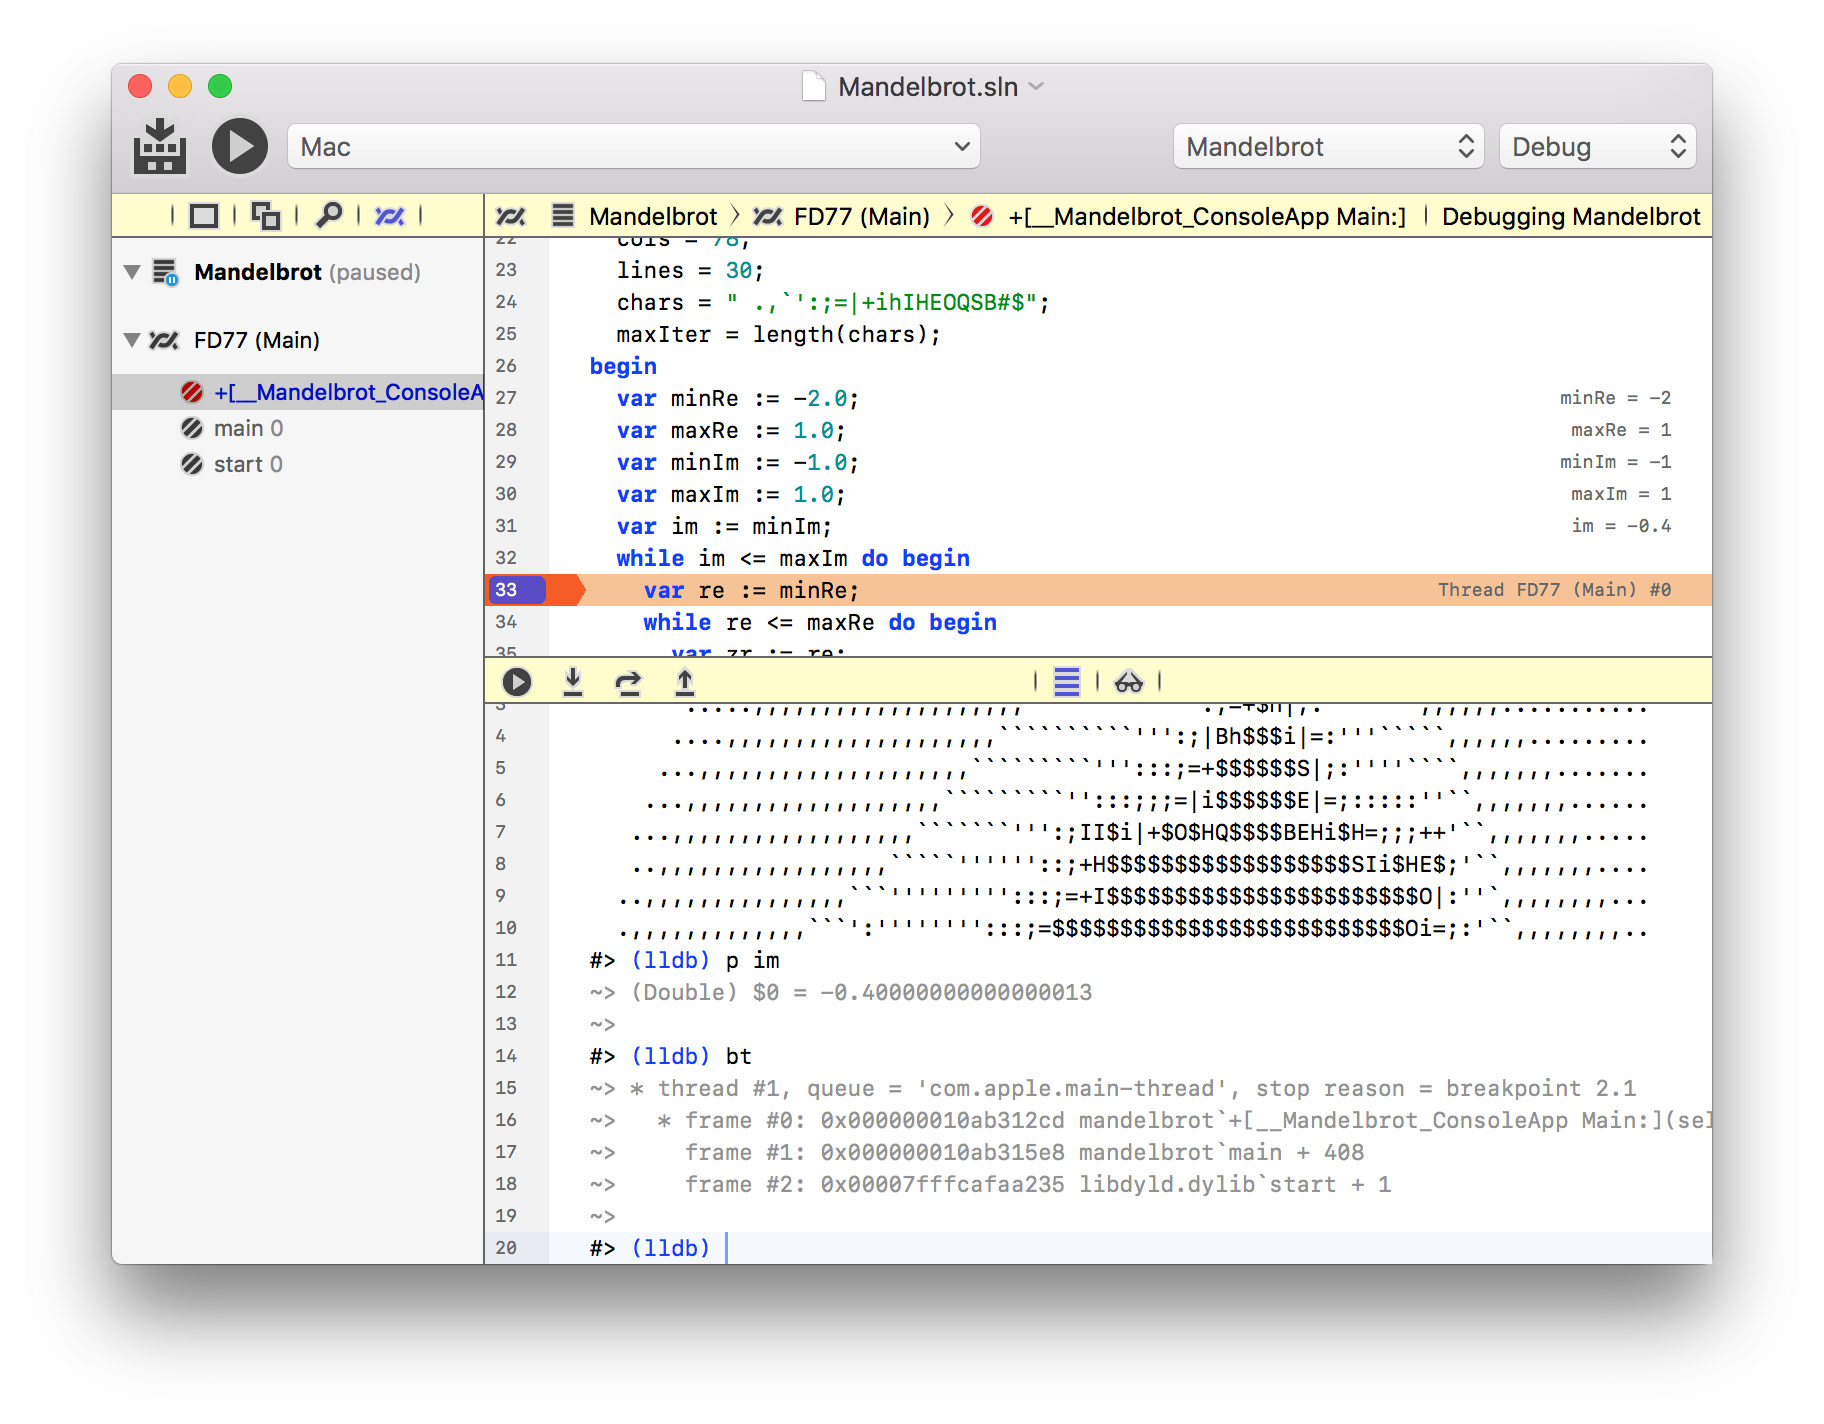
Where available (depending on provided debug symbols), the code editor will show inline evaluations for locals in the current scope, at the right edge of the editor for the line where the variable was declared. This is is similar to the Locals shown in the Debug Inspector.
Inline Watch Expressions
In addition, if your cursor resides on an expression that can be evaluated (including the last part of a compound expression such as "SomeClass.SomeVariable", the editor will try to evaluate ths expression and, if successful, show its value on the right edge..
You can also explicitly select a more complex expression (such as "a + b") to evaluate it.
This is is similar to the custom Watches shown in the Debug Inspector.