Disassembly
On supported platforms (currently Cocoa and Island), you can opt to see a Disassembly view of the underlying assembly code for a given Stack Frame. This option is available whether Debug Symbols are present for the frame in question, or not.
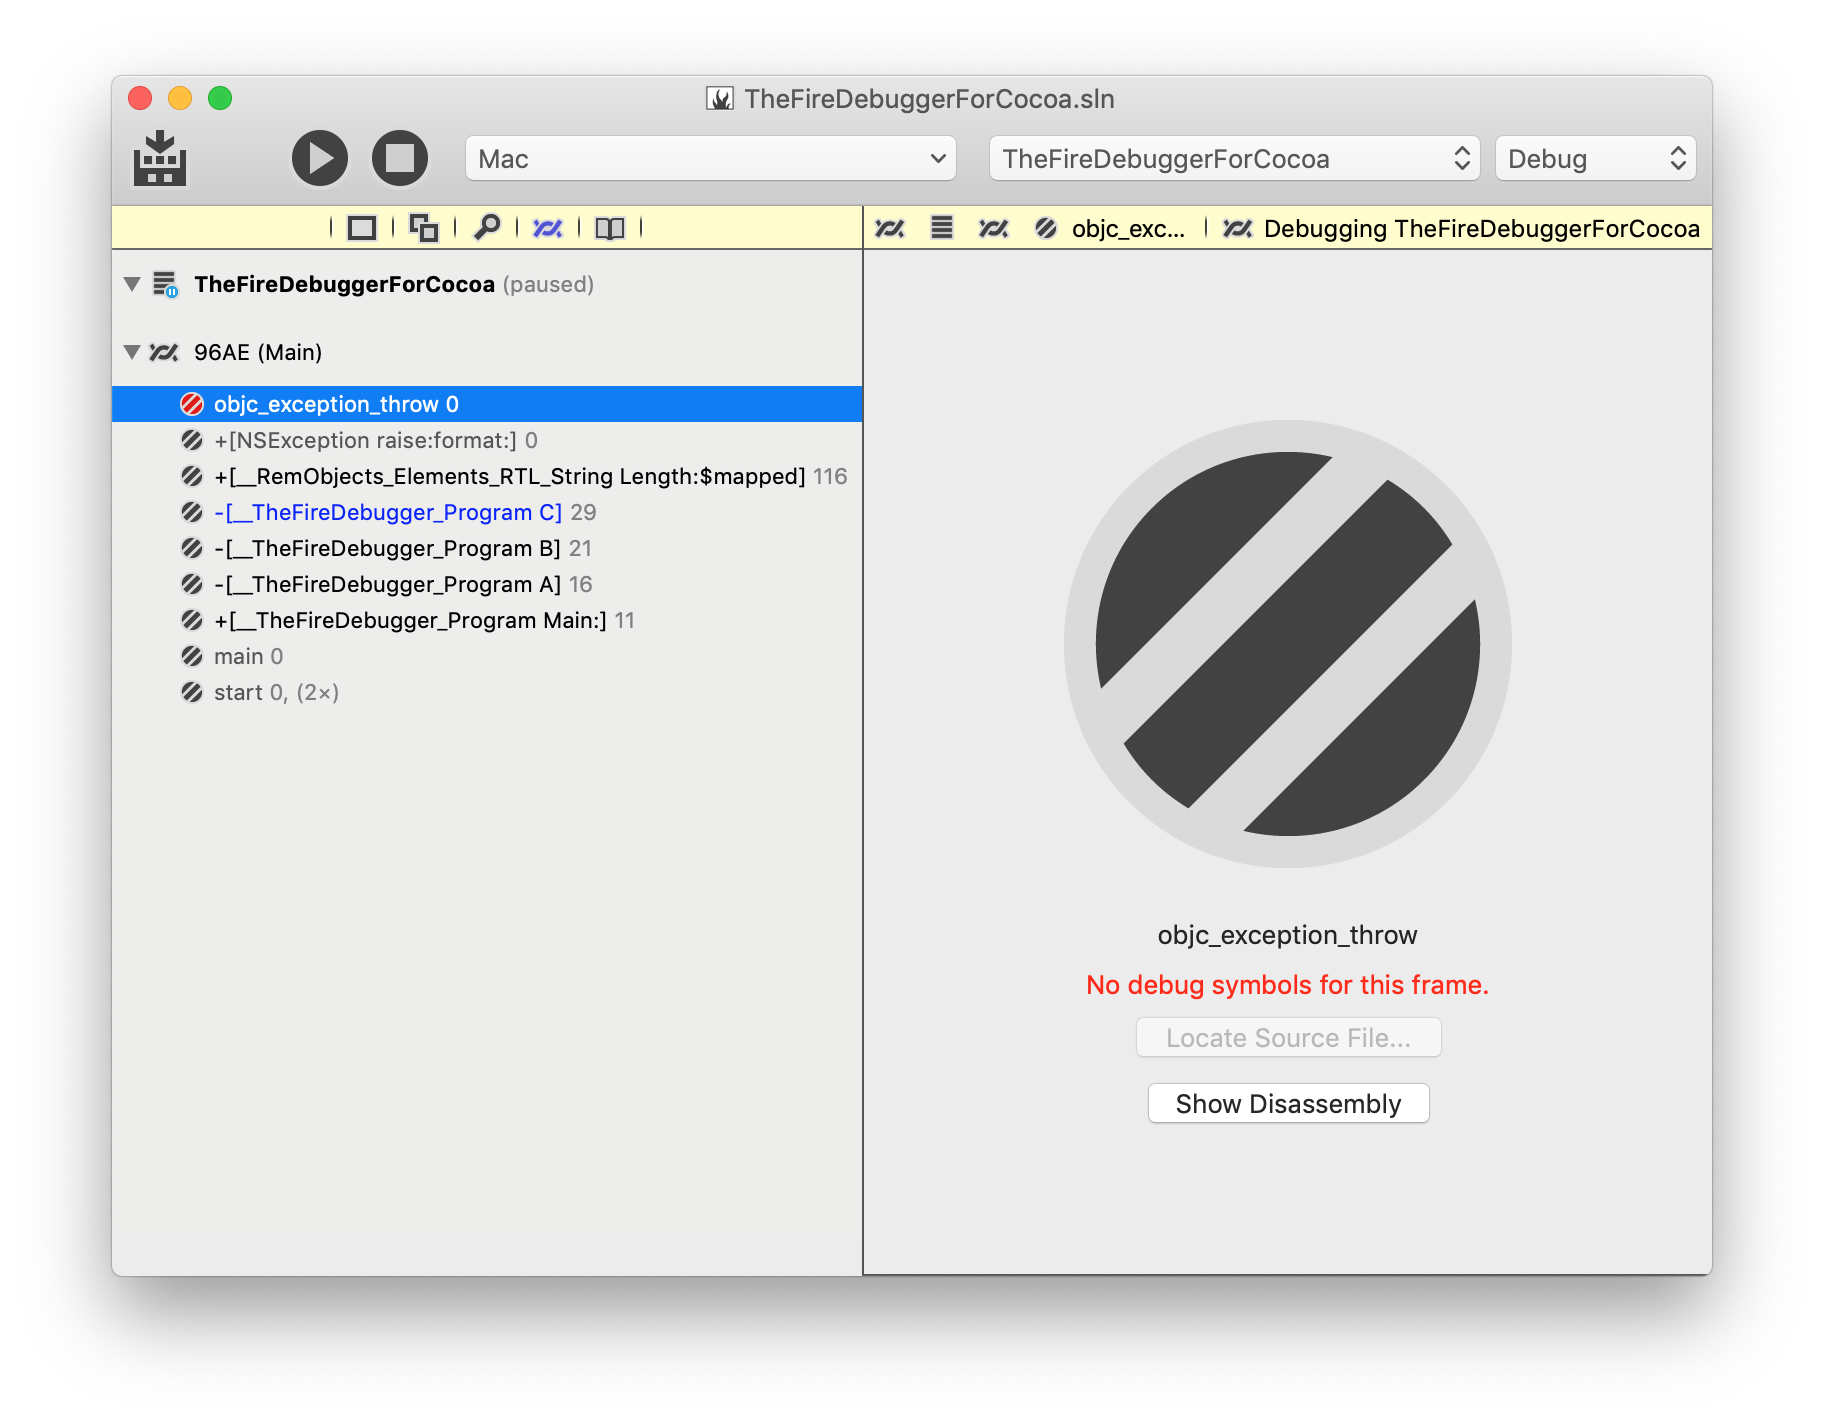
When no Debug Symbols (or no Source) for a frame is available, you can invoke Disassembly directly from the Stack Frame view, by clicking the "Show Disassembly" button:
The view will switch from the generic view to a read-only text view that contains the assembly code for the stack frame. Execution Points will be highlighted, just as they would be for regular source code view – in this case indicating the exact machine instruction that the application is paused on:
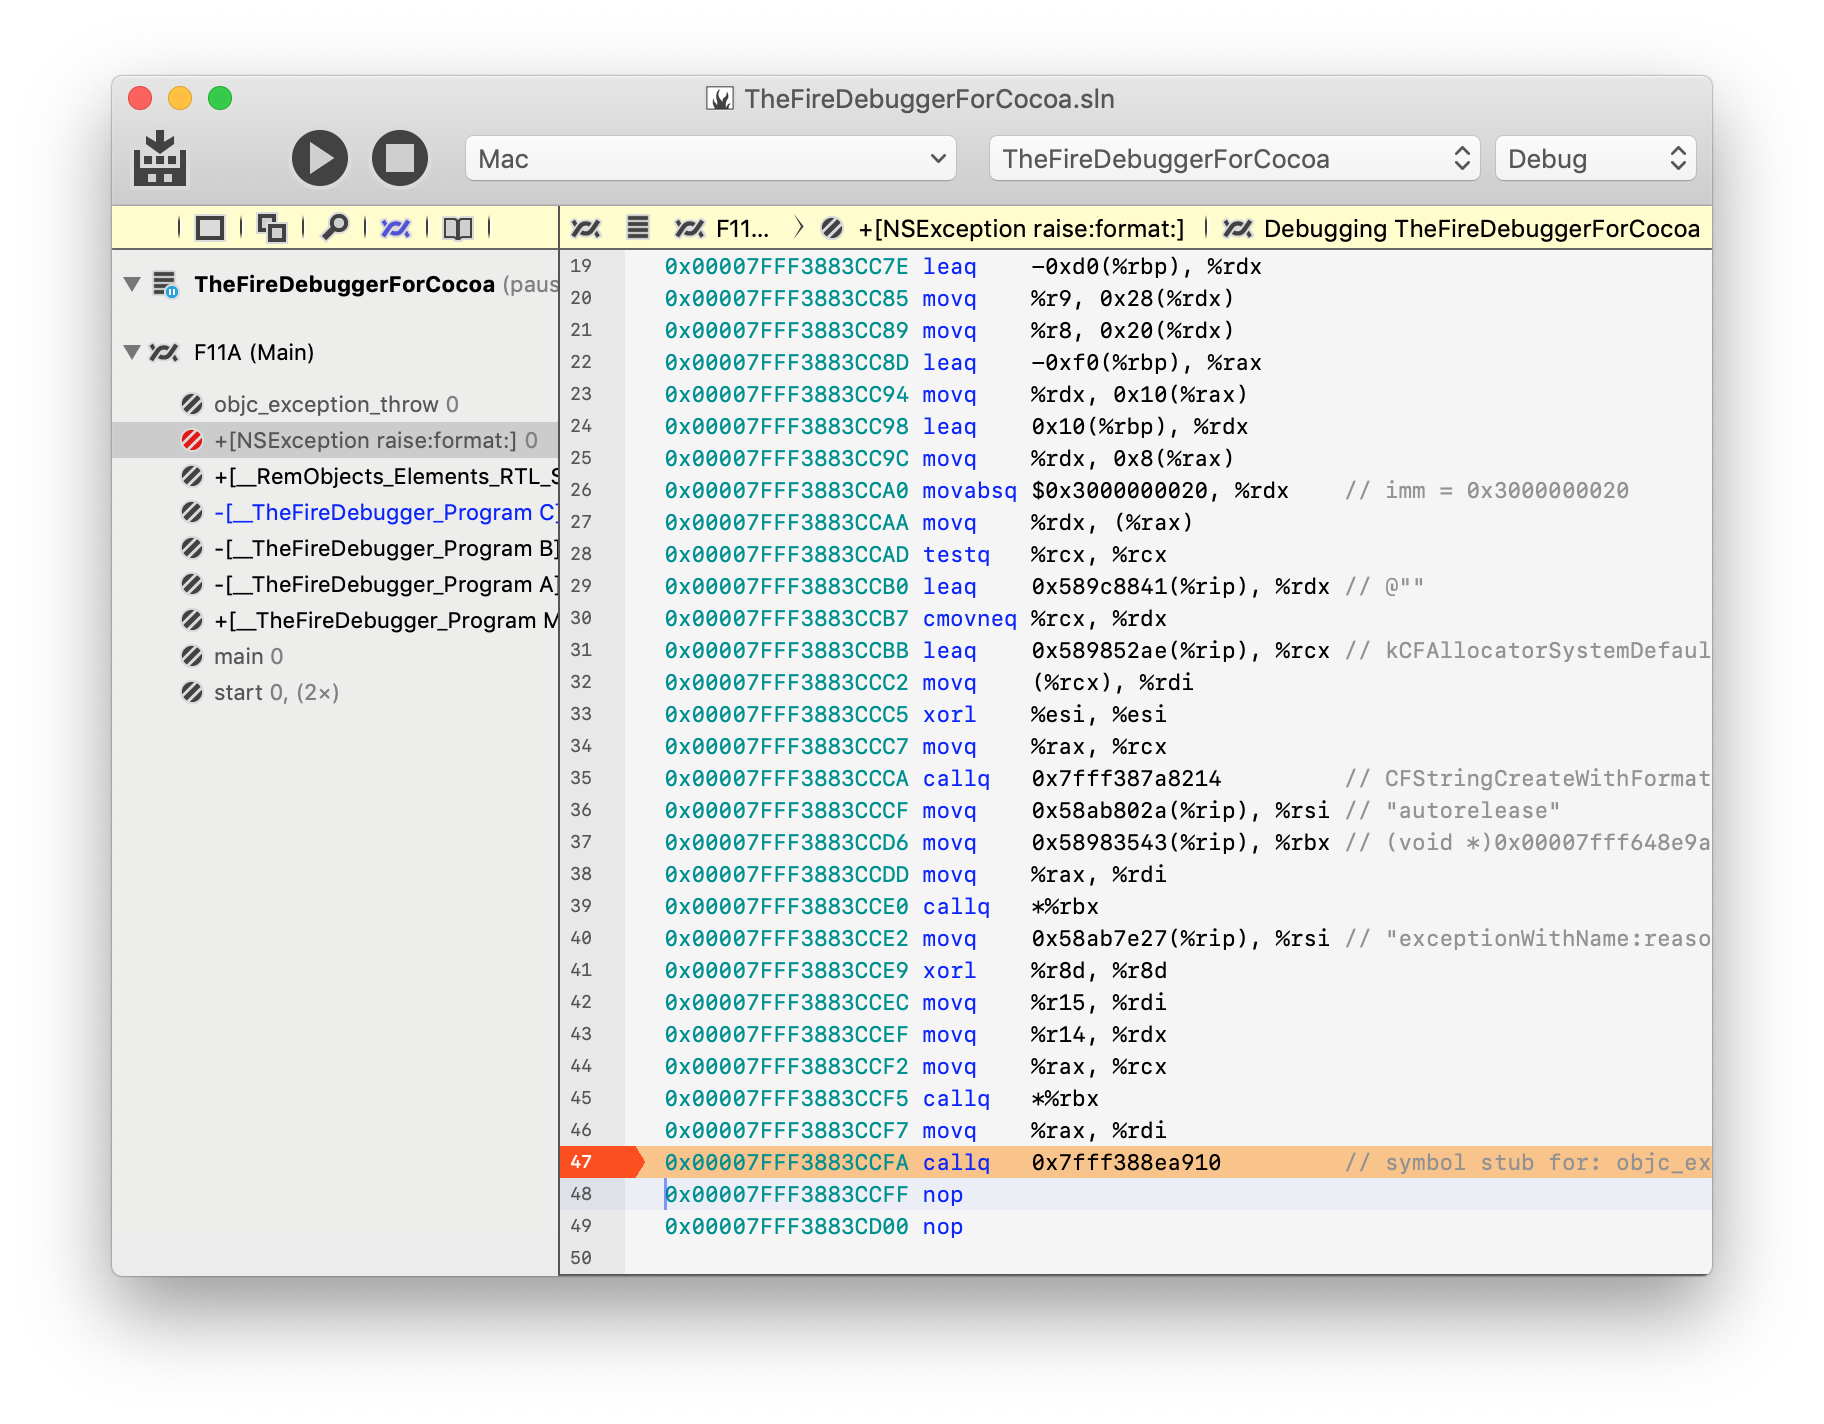
As you can see, comments provide more detailed information about known symbols, where available.
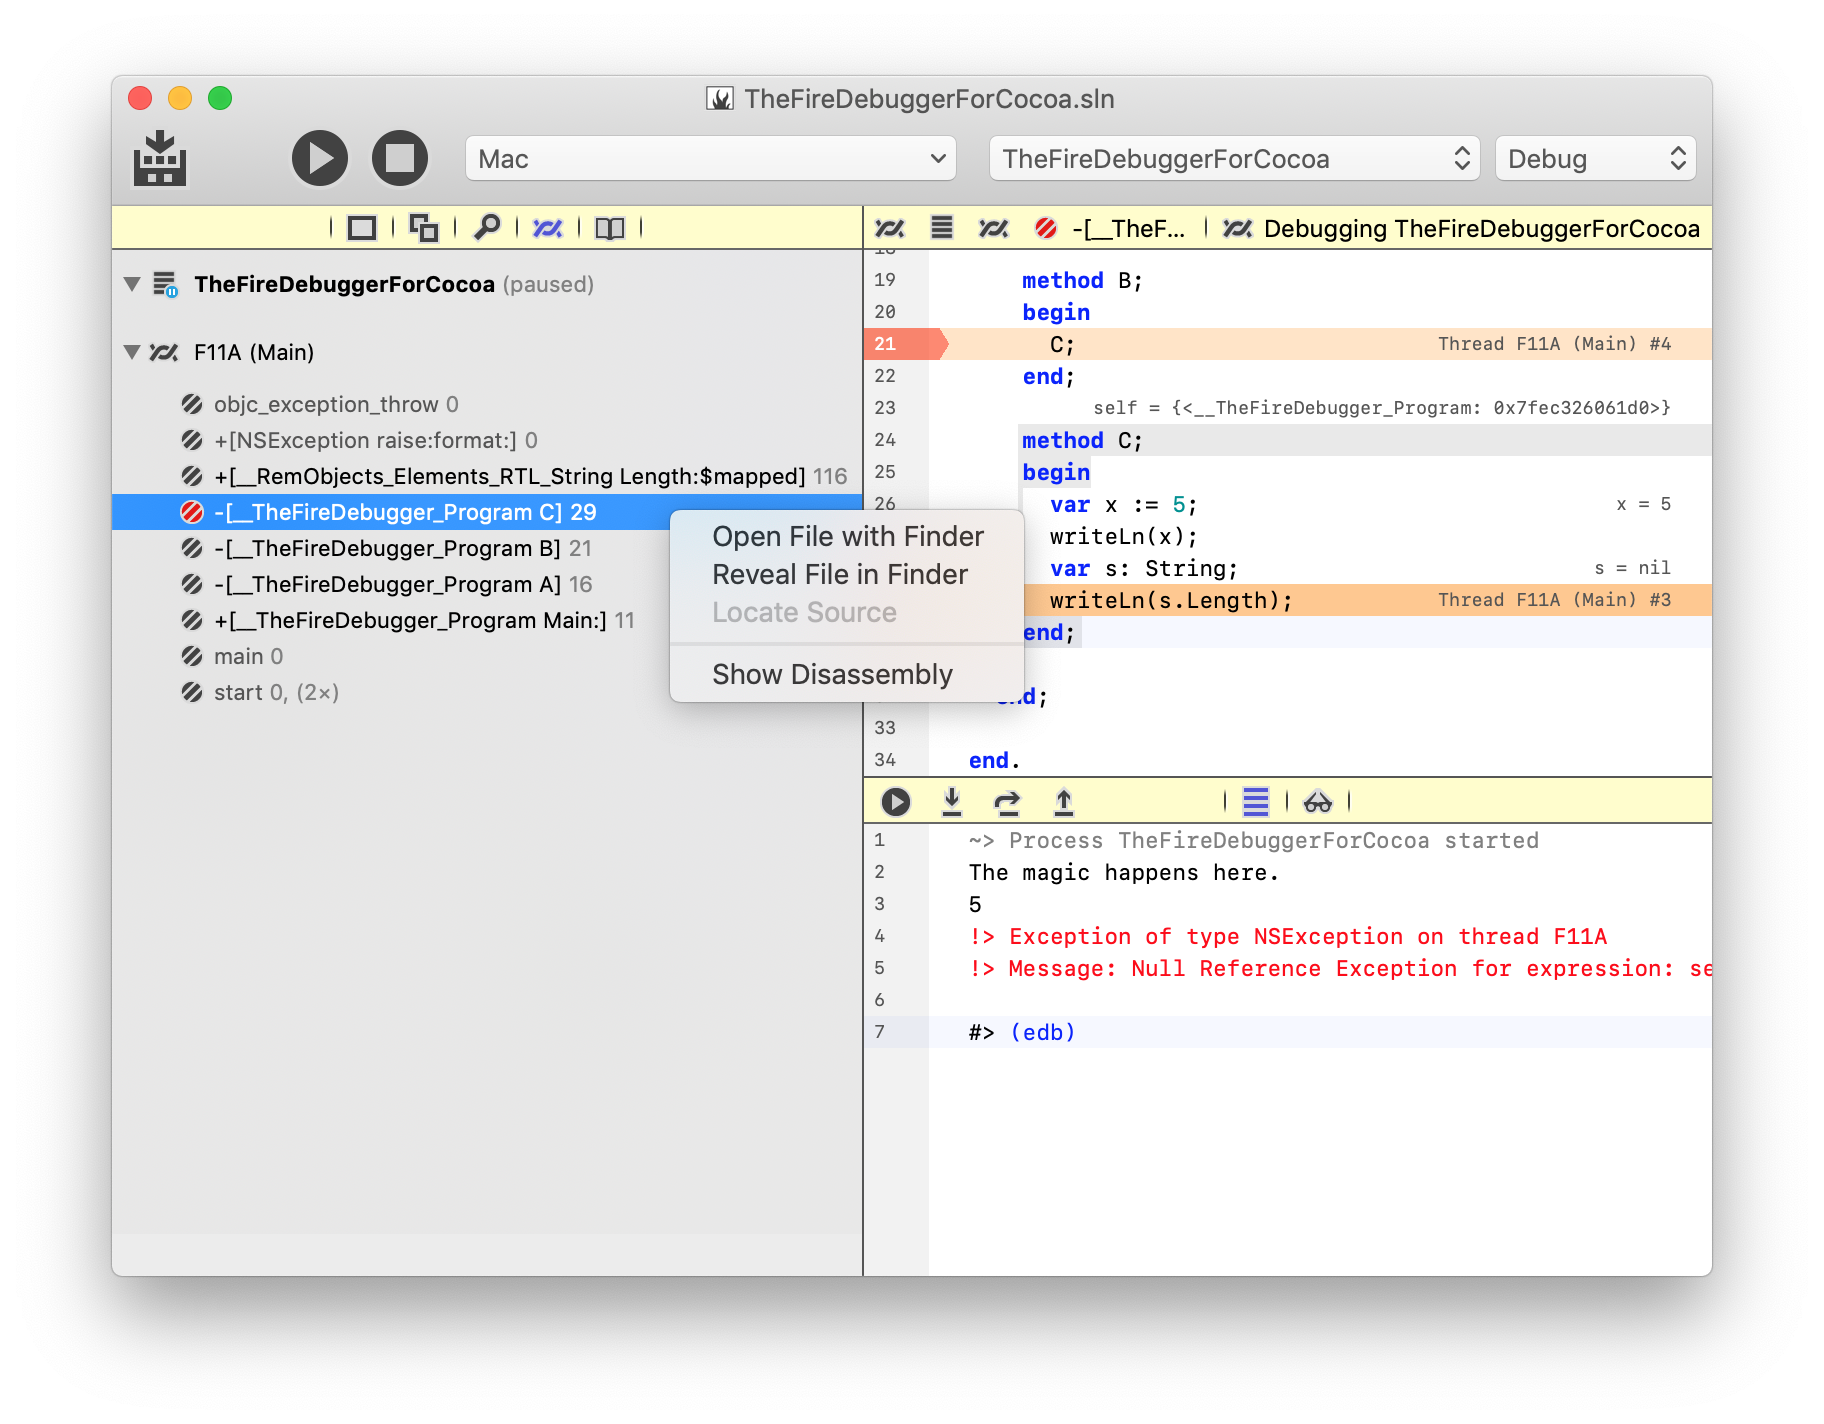
Even if source is available for a method, sometimes it can be helpful to see the underlying assembly, to get a clearer understanding of what exactly is going on, under the hood. For this reason, Disassembly view is also available by right-clicking a stack frame in the Threads and Callstacks pane and choosing "Show Disassembly" from the menu:
Whether an individual stack frame shows disassembly or not wil persist until the Debug Session is resumed, even when switching between frames.
To revert to viewing source code (or the generic Stack Frame view as shown in the first screenshot), you can right-click the frame again, and choose "Hide Disassembly".
See Also
- Cocoa and Island Platforms
- Stack Frame
- Threads and Callstacks Pane