Testing with EUnit in Fire and Water
The Debugger in Fire and Water has a special "Testing" mode that makes it easier for you to run tests created with EUnit, the cross-platform Unit Testing framework for Elements.
This mode provides two main benefits (on top of the existing debugging capabilities available to all applications:
- It captures EUnit results and shows them as messages in-line in the code editor (much like compile-time warnings and errors).
- It allows you to conveniently run a different project than you would when debugging your app.
Running a Test Application in the debugger.
Fire and Water detect if the active project is a Test application based on EUnit, and enable the special "Debug|Test" menu item (and ⌘T/Ctrl+T keyboard shortcut).
When invoking "Test", the IDE will go through the same steps to launch your application in the debugger as it would for a normal "Run", but the resulting debug session will behave slightly different.
-
For one, separate settings are used for whether to stop on Breakpoints and Exceptions, and by default testing exceptions raised by EUnit itself will be ignored.
-
More importantly, for any test failure that happens, details (including the file and line number) are recorded, and the failure is marked inside the editor (and shows up as message in the Jump Bar:
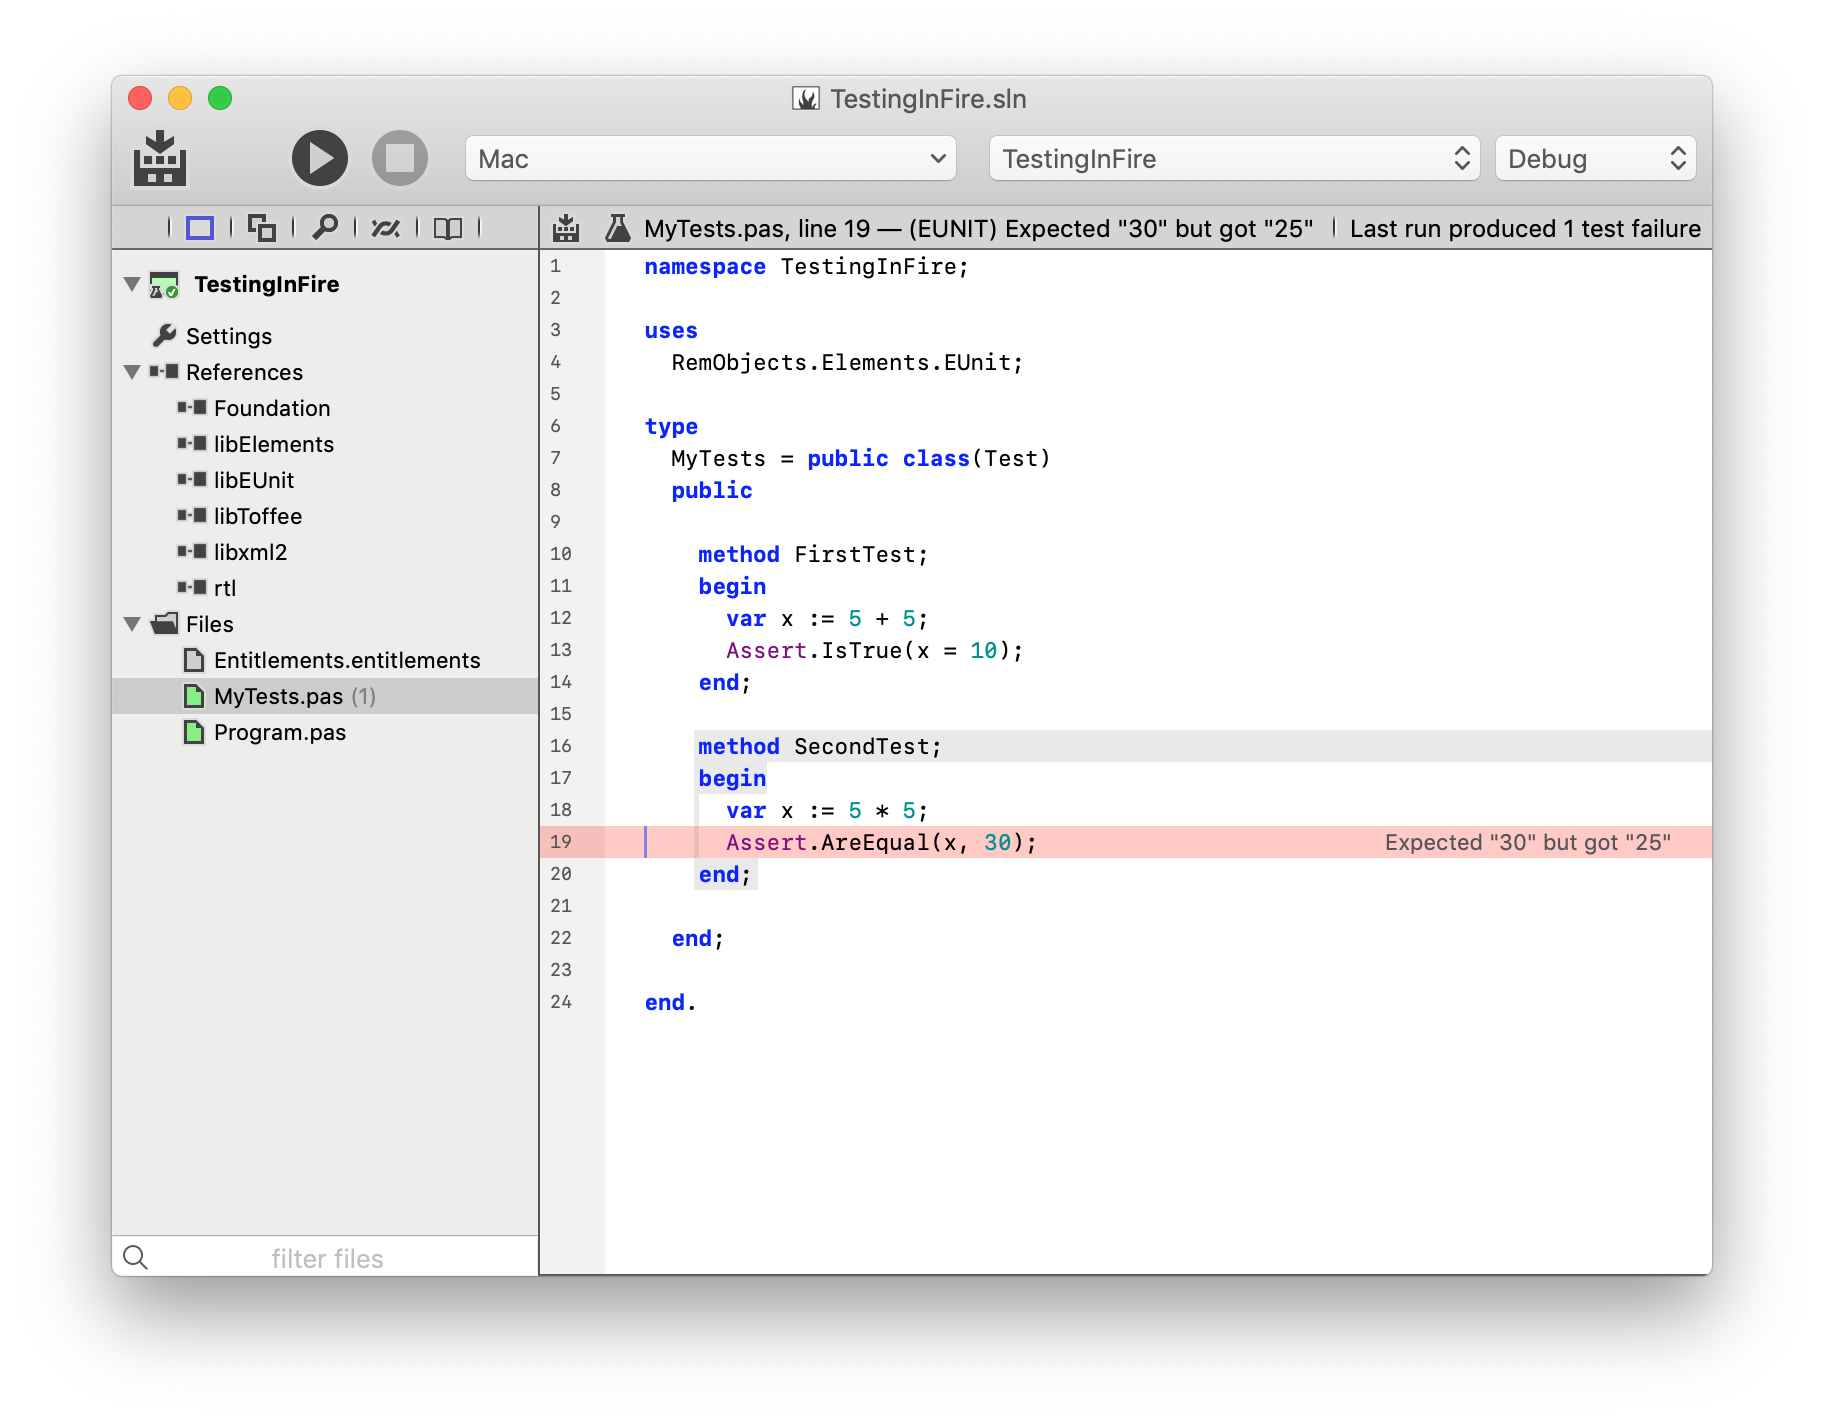
As you can see in the screenshot above, of two (silly) tests in the project, one failed. A detailed message is shown right in the editor, and the Jump Bar at the top contains the test message, alongside any comiler errors or warnings. Of course this means that, once you have selected one failure, you can then use Up/Down Navigation (^⌥Up/Down in Fire, Alt+Up/Down in Water) to move between any other test messages from the run.
In the top right corner, you also see the total number of test failures that were recorded (just one, in this case).
Test Failures in the Debug Console
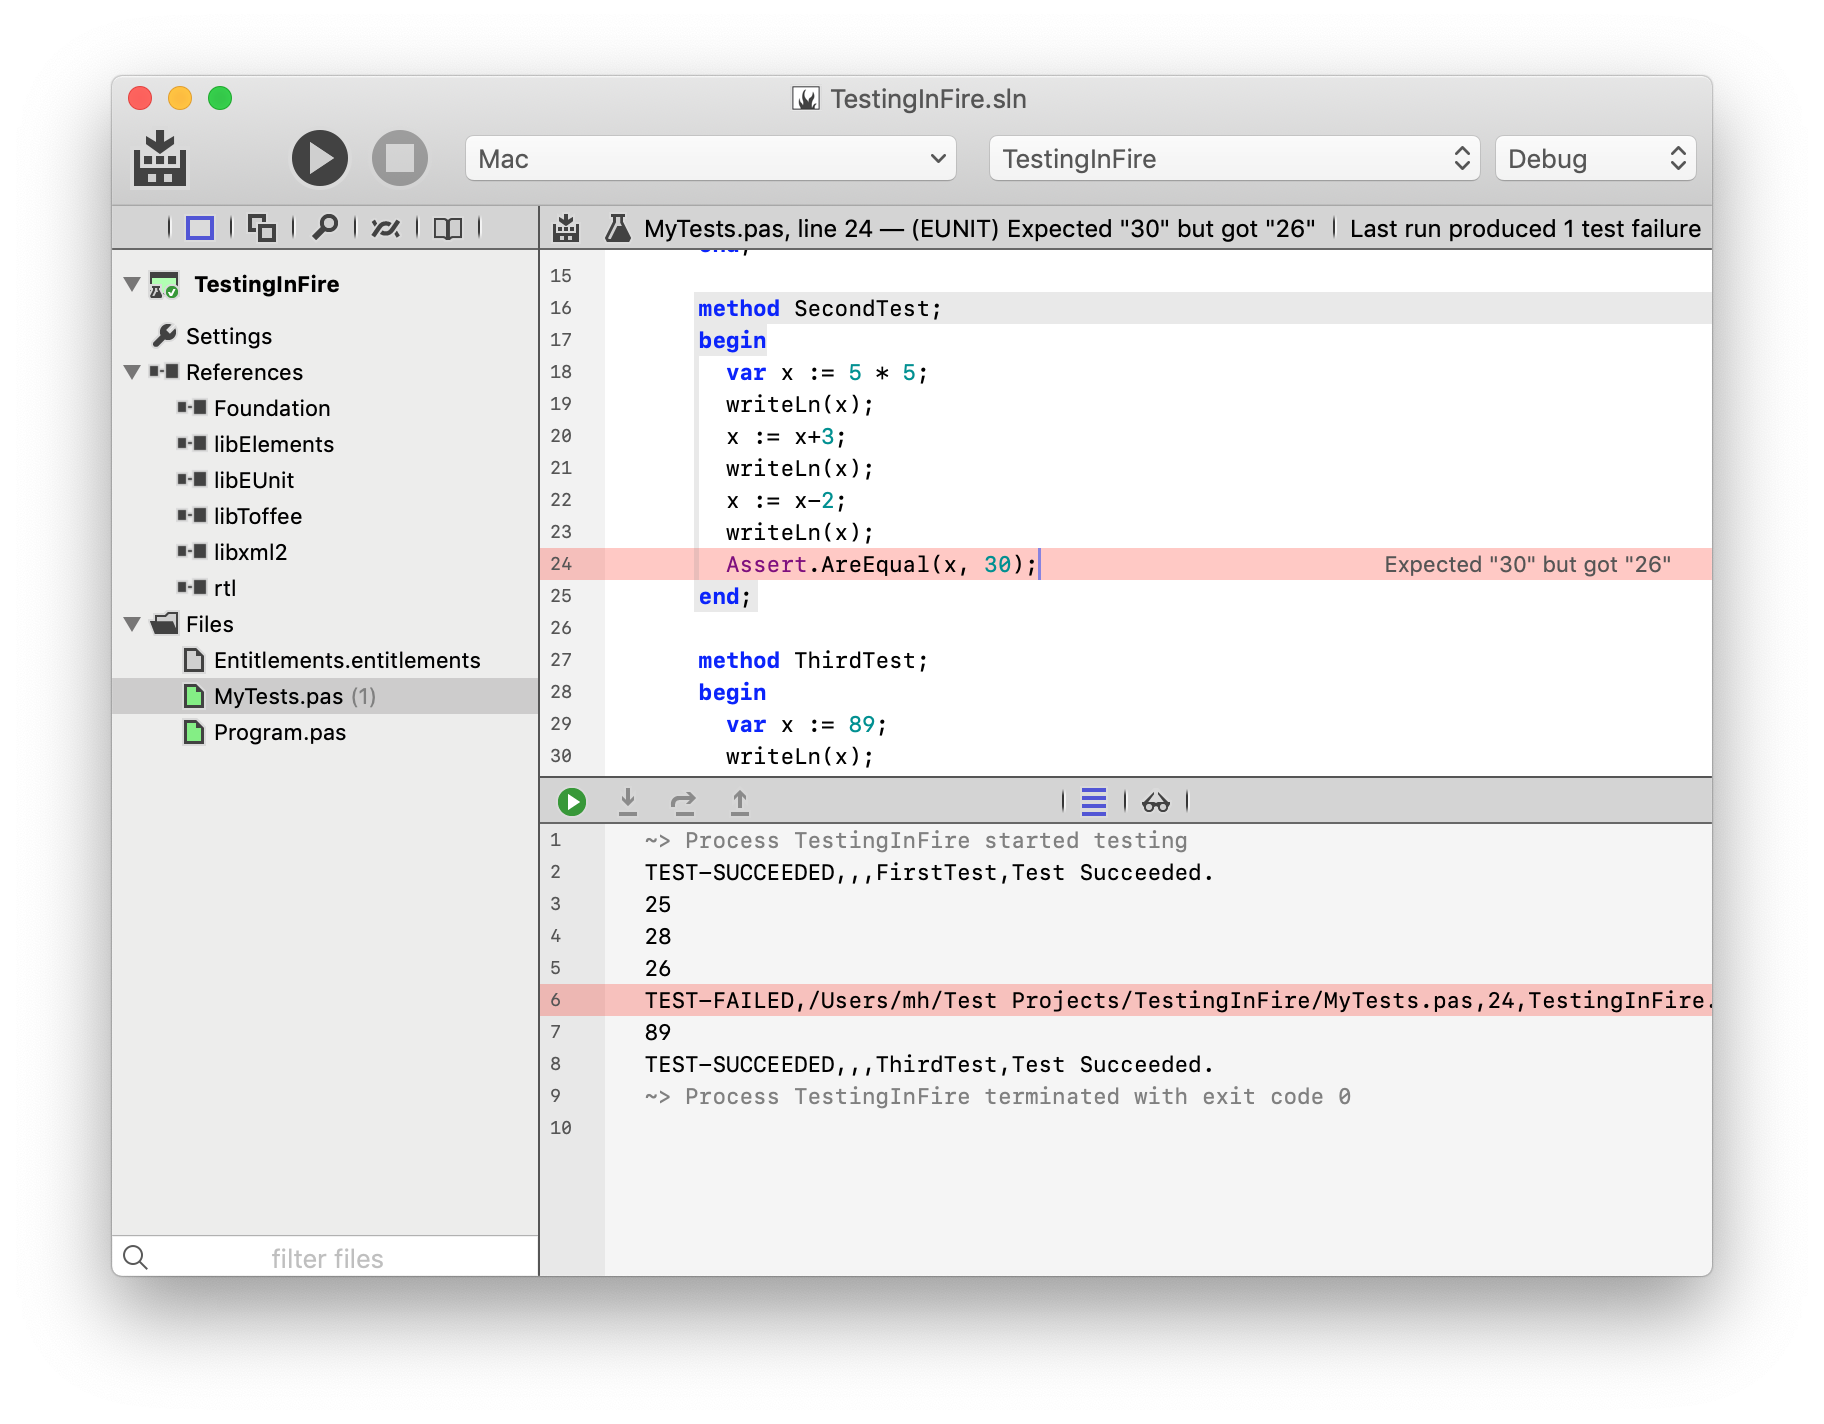
When you look at the Debug Console at the bottom of the IDE, you will also see test failures highlighted alongside of any other expected output your tests might be generating.
This helps you see your failures in context of their surrounding code – for example, a complex test case might print out a variety of details between checks, and in the Debug Console you can expect all that information.
The color-highlighted Test result messages can also be double-clicked right in the console, to jump you to the code place in your code where the test failure occurred.
Regular Debugging Tasks
Of course, your tests run in the regular Debugger, so you have all the capabilities described in the rest of this section to interact with your tests as they run. For example, you can set a Breakpoint on or before the line of a test failure you want to investigate, and then step through the test case to see what is going on.
You can control the breakpoint and exception behavior in Testing mode via three dedicated menu items in the "Debug" menu: "Stop in Breakpoints when Testing", "Stop on EUnit Asserts when Testing" and "Stop on Other Exceptions When Testing".
Using a Dedicated Test Project
Usually, your Test application is separate from the actual project you are working on, and you might want to switch seamlessly between running tests and debugging your actual application, as you make changes to your code.
Fire And Water allows you to set a dedicated Test Application that will be launched when you start a "Test" run, separate from the "Active Project" selected in the top right, which controls which project you are working with and which project will run when you do a normal "Run".
To do this, you will want to have both your main application and the test application in the same Solution, possibly alongside other libraries or Shared Projects.
If you select the "Settings" view (⌘I or Alt+Shift+I) for your main application, you will find a setting called "Test Project", with a picker that lets you choose between any EUnit projects found in the current solution.
Setting the "Test Project" to the right value will tie the two projects together. You can now select your main Application as the "Active Project" in the top right, and work with it as you always would. When you "Run", your application will run normally in the debugger. But when you "Test", your test application will run instead.
Of course, the IDE is smart enough to only recompile the relevant project(s), so for example your main application will not build when you start a test run, and your test application will not be rebuilt when you start a normal debug session.
Running Multiple Test Projects at Once
In some cases, you might have more than one test project in a solution – be it to split tests up into separate suites you can easily run individually, or because your solution is cross-platform and you have a separate test project (or separate targets) for each platform.
Using the "Debug|Test All Projects" menu, you can have all test projects built and run, one after the other. The IDE will start a fresh debug session for each, run the tests, connect all the results, and then move on to the next. At the end, you get all of your test results, across all the individual projects, in one list.
See Also
- EUnit
- Jump Bar
- Up/Down Navigation