Debug Console
The Debug Console is the first tab in the Debug Pane that can optionally be shown at the bottom of the Fire/Water Window, and it is the main way you can interact with the Debug Session and the application you are debugging (in addition of the apps UI, of course). It can be called up with the ⌘⇧1 (Fire) or Ctrl+Shift+1 (Water) keyboard shortcut.
The Debug Console consolidates three main functionalities in one view
- It shows the console output of your program (for console applications, as well as for GUI applications that use the console e.g. for diagnostic messages.
- It shows debugger notifications such as the start and end of the debug session, or Exceptions or Signals that occur.
- It provides an interactive command line to interact with the debugger, when your application is paused.
Console Output
Elements projects generally fall into two broad categories: console applications and GUI applications.
Console applications are meant to be run in a Terminal or Command Prompt window, and emit textual output to what is referred ot as the Console, or stdout ("Standard Output").
GUI applications present a graphical user interface using the platforms GUI APIs, for the user to interact with. This includes mobile apps on iOS, tvOS and Android, or Windows, Mac or Linux Applications. GUI applications typically don't use console output, but they may opt to do so, for debug messages or additional error information.
Note that on Windows (.NET or Native), applications can only emit to the console if their OutputType Setting is set not set to WinExe. Otherwise console output is ignored on the OS level, and not visible even when running the app in a Command Prompt window, or in the Water Debug Console.
Also note that on Android, there is no console output at all. Applications can only send text messages to the separate logcat Device Log.
There are a few ways for an application to emit text to the console:
- The platform- and language-independent
write() and writeLn()System Functions. - The platform- and language-independent and expandable
Log()infrastructure in Elements RTL. - Language-specific functions such as
print()from the Swift Base Library. - Platform-specific APIs such as
System.Console.Writeon .NET orNSLogon Cocoa.
Any content emitted by your application to the console will show in the Debug Console (instead of a separate Terminal or Command Prompt Window!), when debugging your app from Fire or Water. (When running outside of the debugger, a Terminal or Command Prompt Window will open (and mighty close immediately after your app finishes).
Debugger Notifications
The Debug Console also shows debugger notifications. You can tell these apart from console output by the fact that they are color-coded, as gray for benign debugger output, and red for Exceptions.
You will see a notification when the process starts, and when it ends (including the total run time, and the exit code, where relevant). You will also see informational messages for all exceptions (including the ones that pause the debug session, and those that are set to be ignored (the latter show in gray), and for other debugger events.
Interactive Debug Prompt
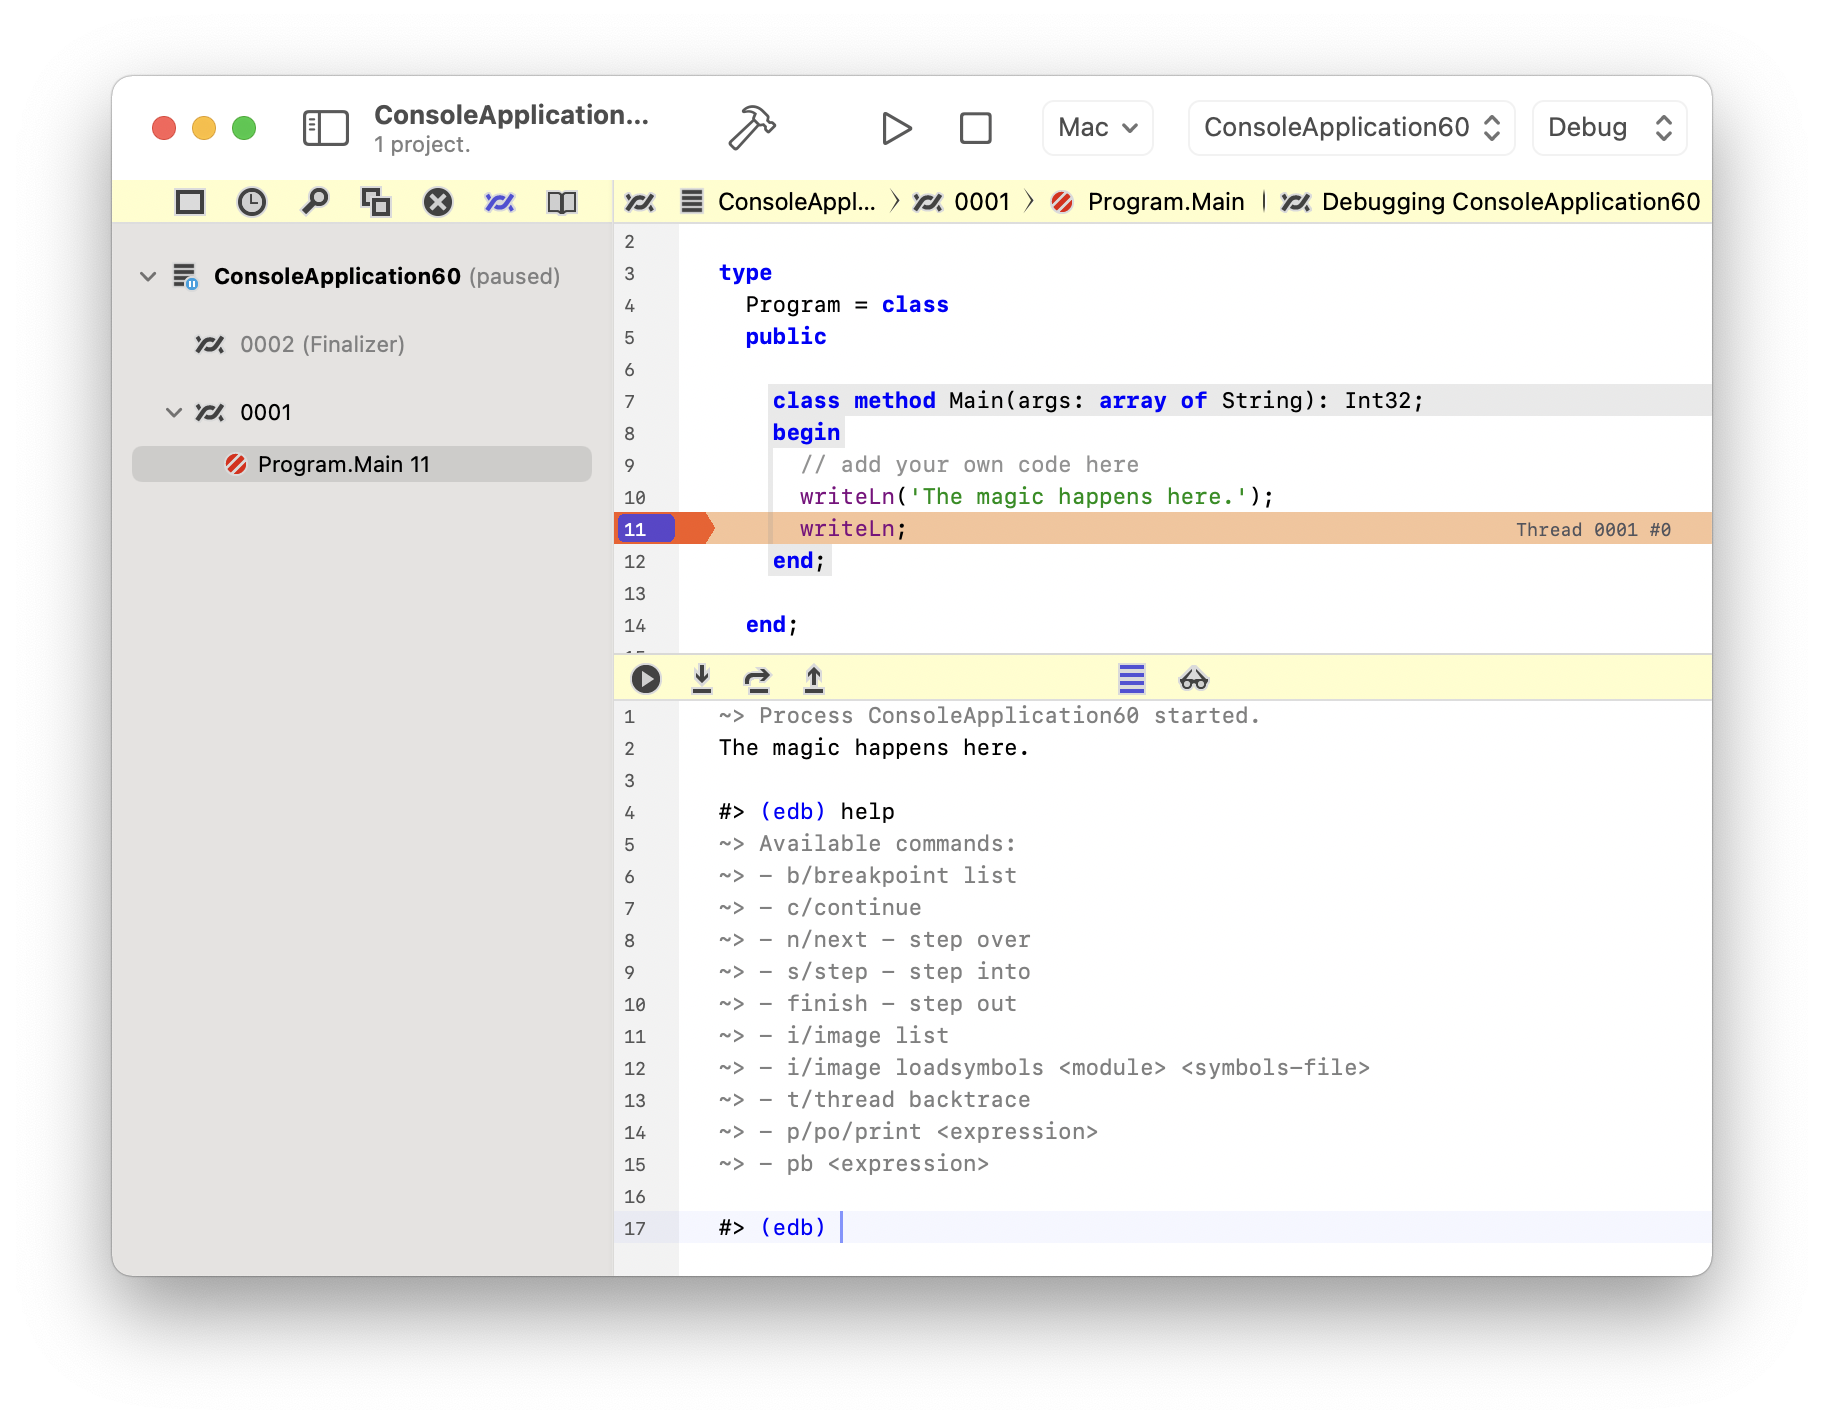
The console window is read-only normally, with one exception: when your debug session is paused (on a breakpoint, due to an exception, or because you manually hit the Pause button or menu item), the #> (edb) command prompt will appear on the last line, and you will be able to enter and execute commands to interact wit the debugger.
Some commands will emit information while others will affect and control the sate of the debugger. for example the "continue" (or "c") command will resume debugging of your app, same as if you pressed the Continue button or selected the "Continue" menu.
You can type "help" to see a full list of all supported commands. Availability of some commands might depend on the platform or debug engine you are using at the time.
Where "help" lists commands with a slash (/), you can use either the short version or the long for to execute the same command. for example "s" will do the same as "step".
WHile the cursor is on the line with the #> (edb), you can use the cursor-up and cursor-down keys to recall previous commands to emit them again without retyping.
Command Reference
"breakpoint" Command
The "breakpoint" command, or "b" for short, works with breakpoints. Right now, it only supports one subcommand, "list" that will emit a list of all defined breakpoints and their details.
"backtrace" Command
The "backtrace" command, or "bt" for short, will list all frames of the call stack for the current thread. If the optional "all" parameter is provided, the debugger will loop all threads and emit the backtrace for each one.
"continue" Command
The "continue" command, or "c" for short, will resume execution of the debug session, same as the "Debug|Continue" menu item or the black "Play" button in the Debug Pane tool bar.
"next" Command, will resume execution of the debug session to the next statement, same as the "Debug|Step Over" menu item or the "Step Over" button in the Debug Pane tool bar.
"step" Command
The "step" command, or "s" for short, will step into the next statement, same as the "Debug|Step Into" menu item or the "Step Into" button in the Debug Pane tool bar.
"finish" Command
The "finish" command, or "f" for short, will step out of the current method or scope, back to the calling stack frame same as the "Debug|Step Out" menu item or the "Step Out" button in the Debug Pane tool bar.
"image" Command
The "image" command, or "i" for short, provides information about the binary images or modules loaded into the current process.
The "image list" command emits a list of all loaded images, including their address and file path. This can be helpful to determine if a library was loaded from the expected path, or confirm it's location in memory.
The "image loadsymbols" command allows to manually load debug symbols for a given image. The index iof the image (as shown by "image list") must be provided a second parameter. A path can be provided as thirds parameter; if it is omitted, a File Open dialog will sow and let you pick the file manually.
The "image loadelementssymbols" is for internal use when debugging Water and Elements.
"thread" Command
The "thread" command, or "t" for short, works with threads. Right now, it only supports one subcommand, "backtrace" that will emit the backtrace for the current thread (same as backtrace).
"print" Command
The "print" command, or "p"/"po" for short, will print the value of an expression to the console. It must be followed by the an expression understood by the language of the current source file and is valid in the current debug scope.
The expression evaluator does not have the full capabilities of the comiler. f an expression cannot be evaluated, try simplifying it.
"pb" Command
The "pb" command, or "pb" for short, works similar to "print", but will also copy the resulting value to the pasteboard/clipboard, in addition to printting it to the console.
"help" Command
The "help" command will print a list of all know commands.