Attaching
Sometimes, rather than launching thje project you are currently working on in the debugger, you need to attach to a process that is already running on your system to debug it.
There can be many reasons for this. Maybe your application is already running "in production" and you encounter a bug you want to debug live. Or maybe your project is library that's "hosted" in a different process, out of your own control.
It is also possible to debug application not created with Elements, as long as they are of a type supported by the Elements debugger. If those applications have debug symbols and your (optionally) have the source code, you can even step through code written in different languages, such as C, C++, Objective-C, Visual Basic, or the like.
Attaching to process from Fire or Water is simple. Via the "Debug|Attach to Process.." menu item, you can open the "Attach to Process" sheet, which allows you to select a process to debug:
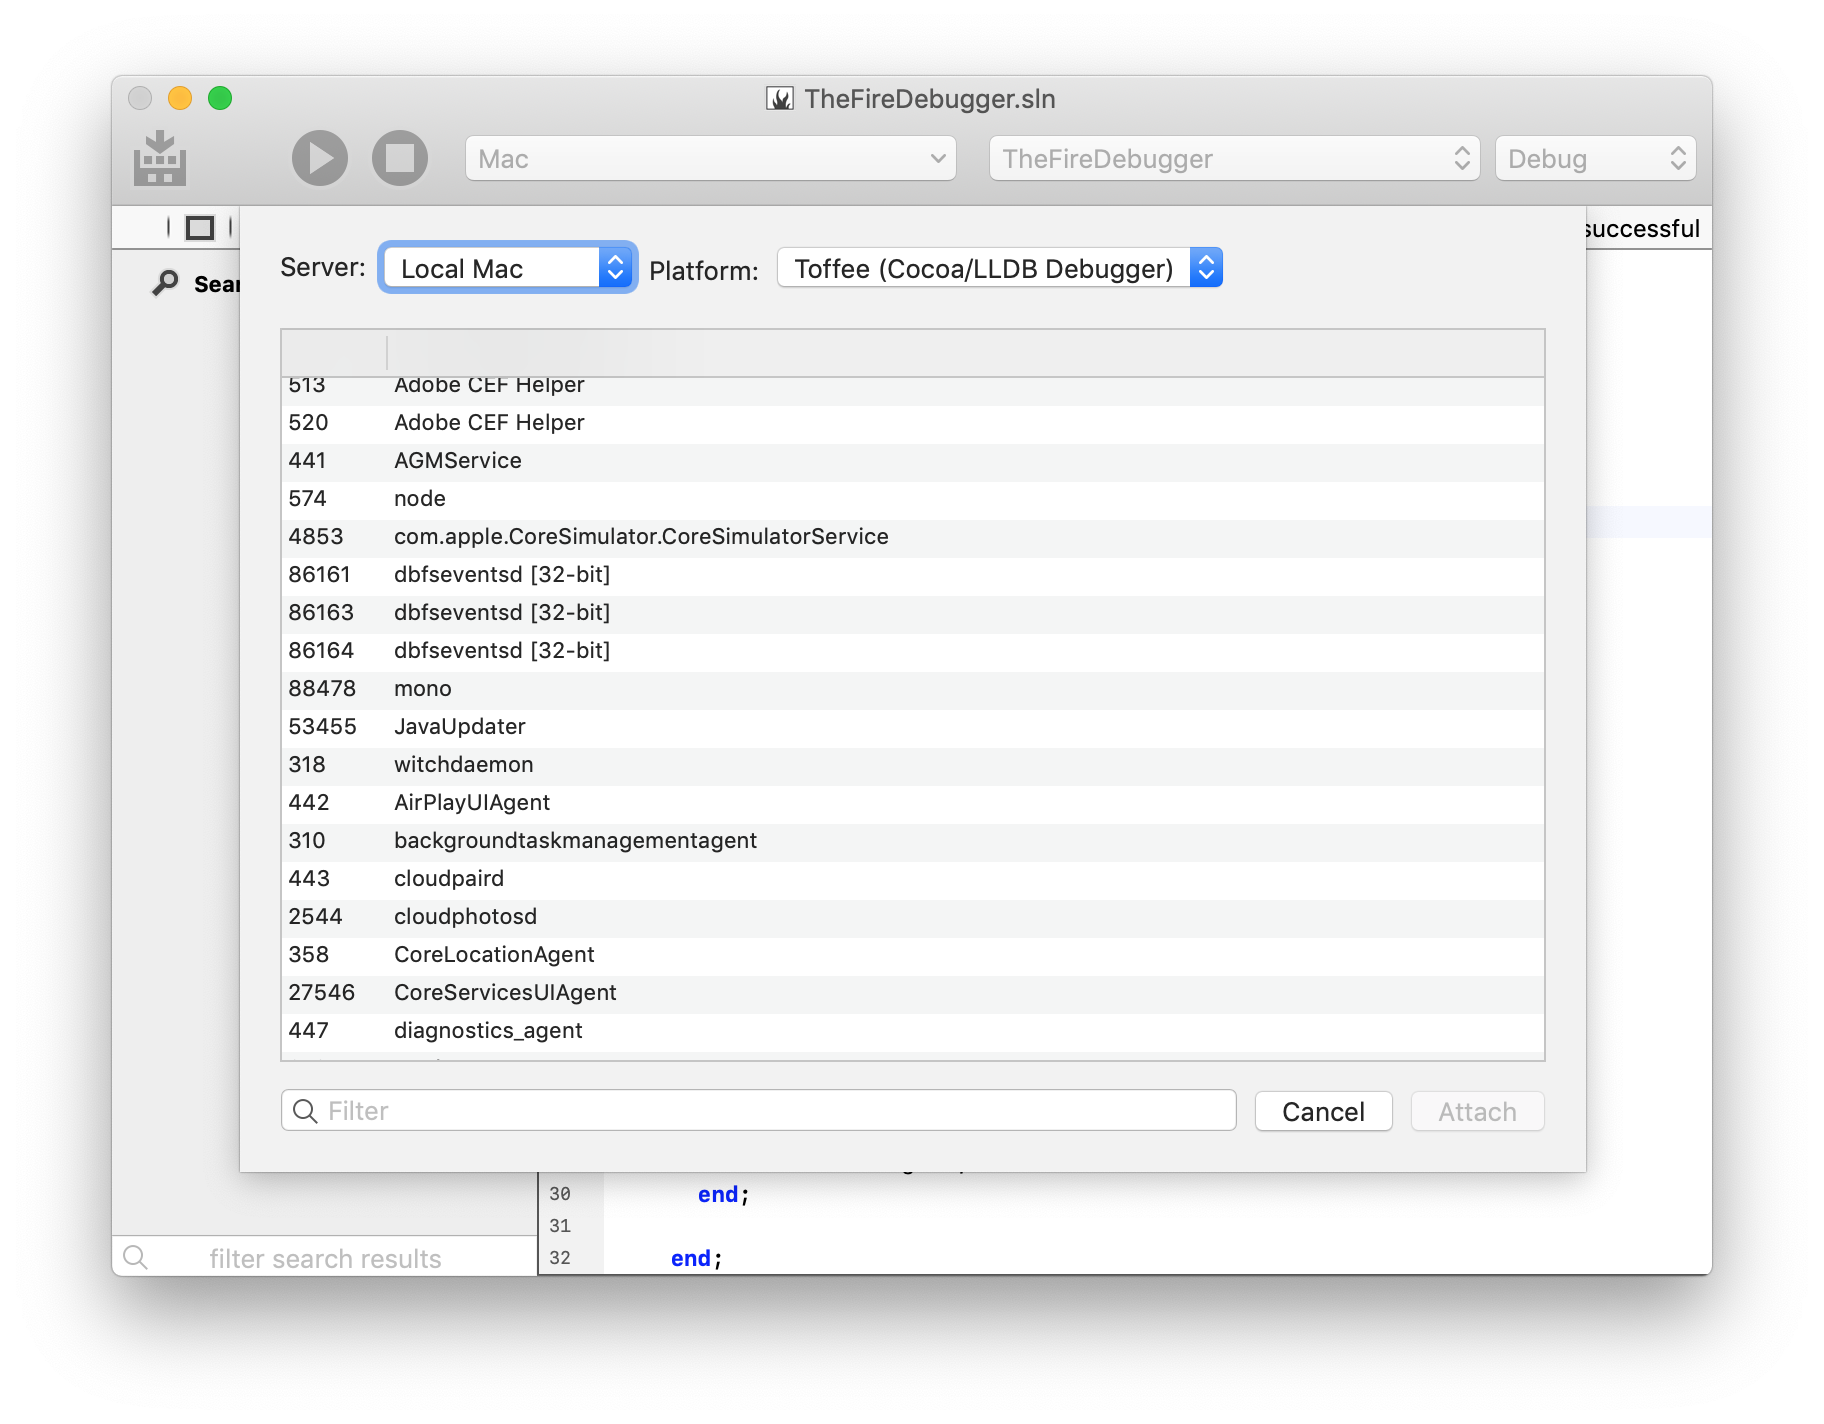
In Fire on Mac, you can attach to native processes, using either the LLDB-based Cocoa debugger (the same debug engine used by Xcode), or Elements' own native Island debugger. Both engines can debug Cocoa, Island and other native Mac applications.
Fire does not support attaching the Mono or Java debugger, because unfortunately neither the Mono or the Java runtime support this feature; Mono and Java processes can only be debugged (on managed level) when launched with the debugger. (Of course you can attach the native debugger to Mono and Java processes, to debug them on native level).
Right now Fire only allows attaching to local processes running on your Mac.
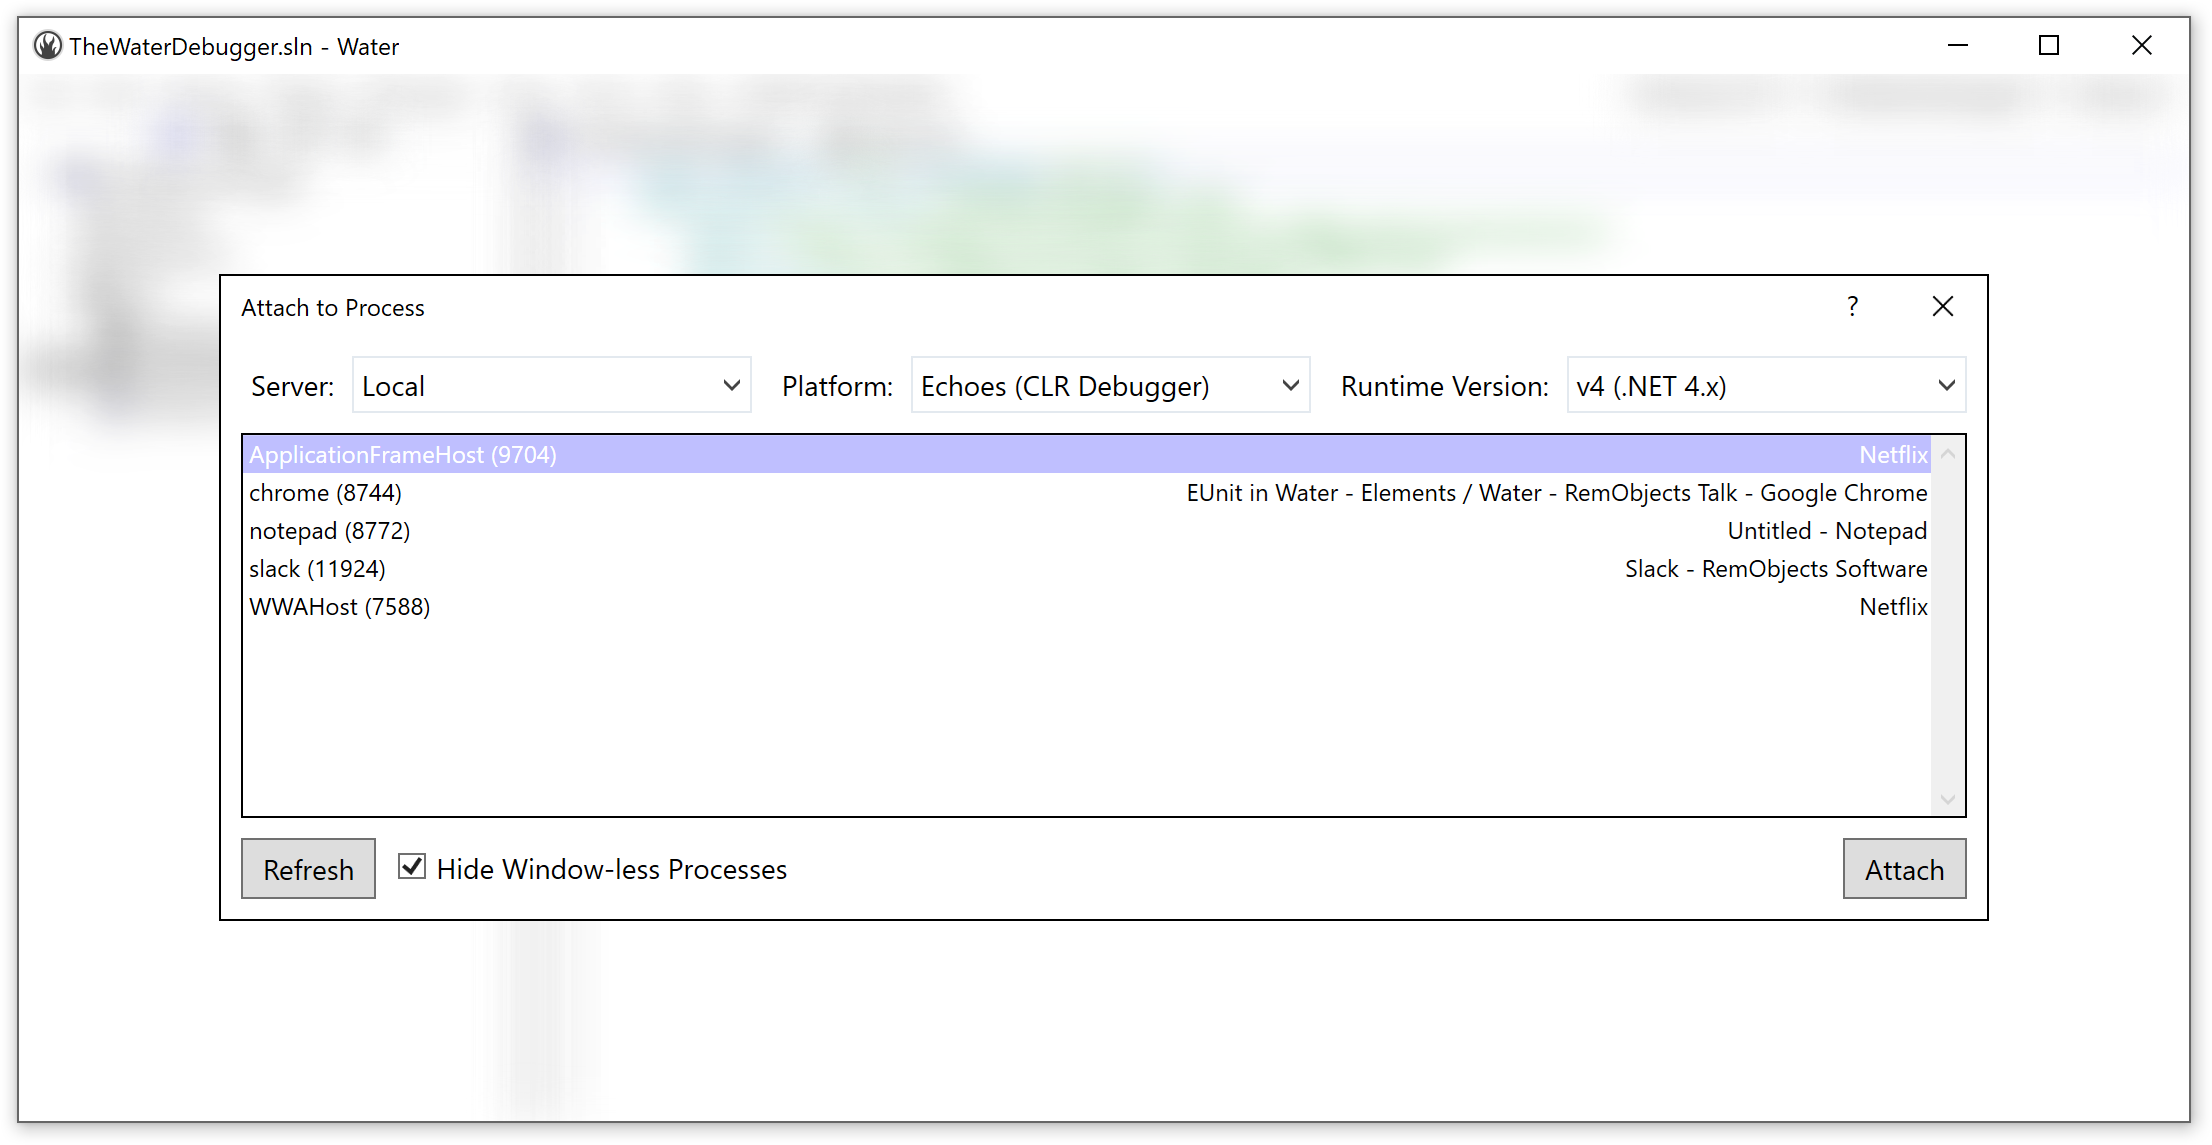
In Water on Windows, you can attach to
- .NET Framework processes, using the CLR debugger.
- natively processes using the Island debugger (which can be used even on non-Island apps).
For CLR debugging, you can (must) choose whether to attach to the .NET 2.x or .NET 4.x runtime, which use separate debugging APIs. (Most modern .NET applications use .NET 4.0 or higher.)
Water does not support attaching the Mono or Java debugger, because unfortunately neither the Mono or the Java runtime support this feature; Mono and Java processes can only be debugged (on managed level) when launched with the debugger. (Of course you can attach the native debugger to Mono and Java processes, to debug them on native level).
Water also allows you to attach to remote processes on known CrossBox servers. You can use the native Island debugger on Windows and Linux servers, and either the Island debugger or the LLDB-based Cocoa debugger, on macOS.
You can can choose which debug engine to use (and, in Water, what server to connect to or which CLR version to use), using the popup buttons at the top of the "Attach to Process" sheet.
The main area of the sheet provides a list of all processes that are running on the local computer or, in Water, the selected CrossBox server. You will see the process ID name and (on Windows) application title. Processes that are 32-bit will have an additional indicator.
Select the process you want to debug to and click "Attach". This will (try to) start a new Debug Session.
Note that not all processes can be attached to. Some processes might run in a protected mode that disallows debugging (such as many Apple-provided system applications, on macOS), or your user account might not have the proper rights to attach to them. Also, you might be trying to attach the CLR debugger to a process that does not host the .NET runtime.
If attaching fails, you will see an error message, and the "Attach to Process" sheet remains open. If attaching is successful, you will see the Jump Bar turn yellow, the "Attach to Process" sheet will close, and you'll be ready to debug, for example by Pausing the application.
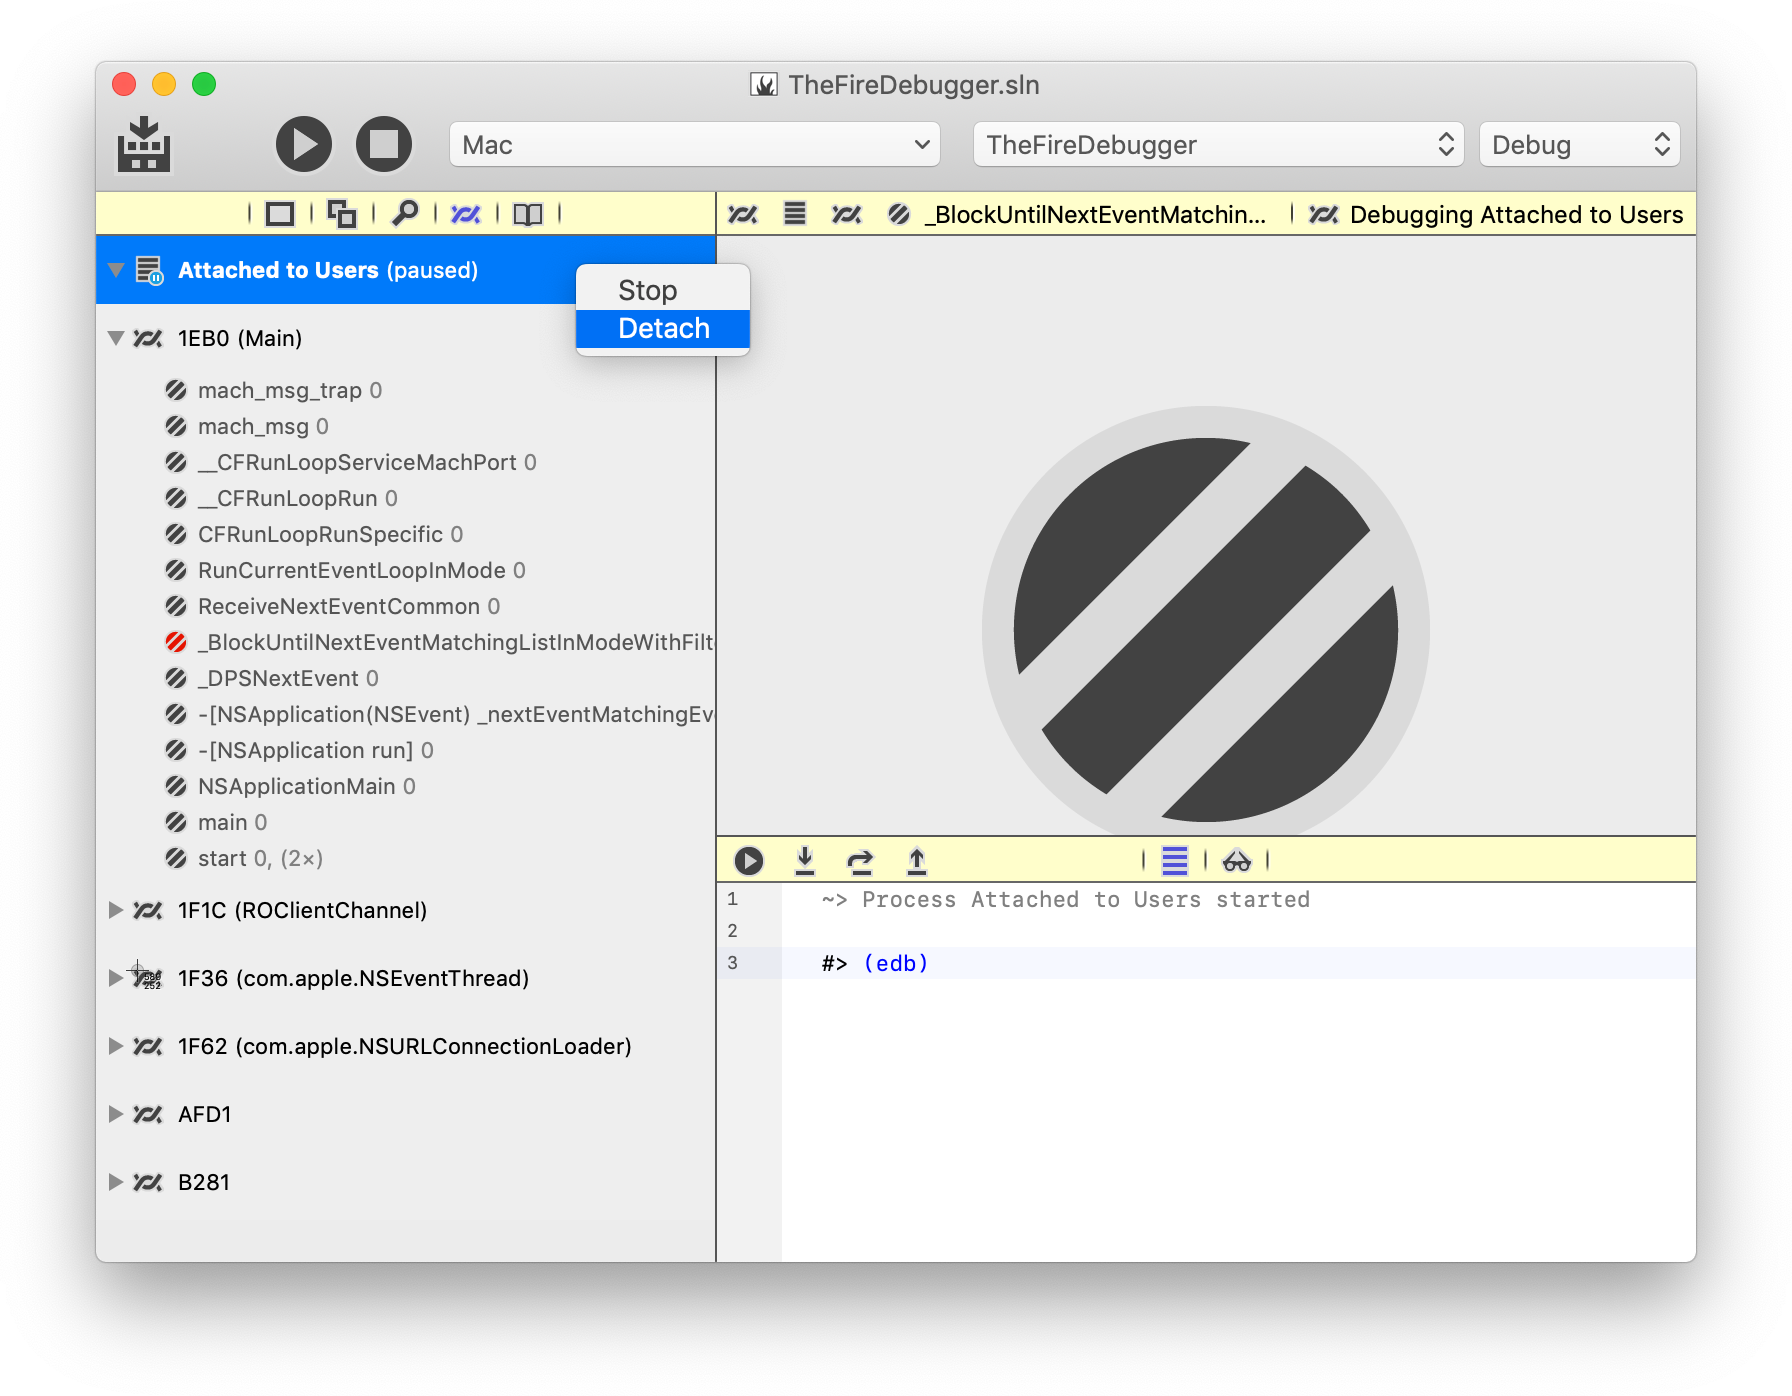
Note that a Debug Session can be ended either by detaching from the process (but leaving it running) or by stopping the process. The default ⌘./Ctrl+. shortcut will default to "detach", for attached debug sessions, and to "stop" for debug sessions launched via "Debug|Run.
You can stop a session by right-clicking the debug session's node in the Threads and Callstacks pane and choosing "Stop" instead of "Detach".
See Also
- Debugging
- Debug Session
- CrossBox Servers