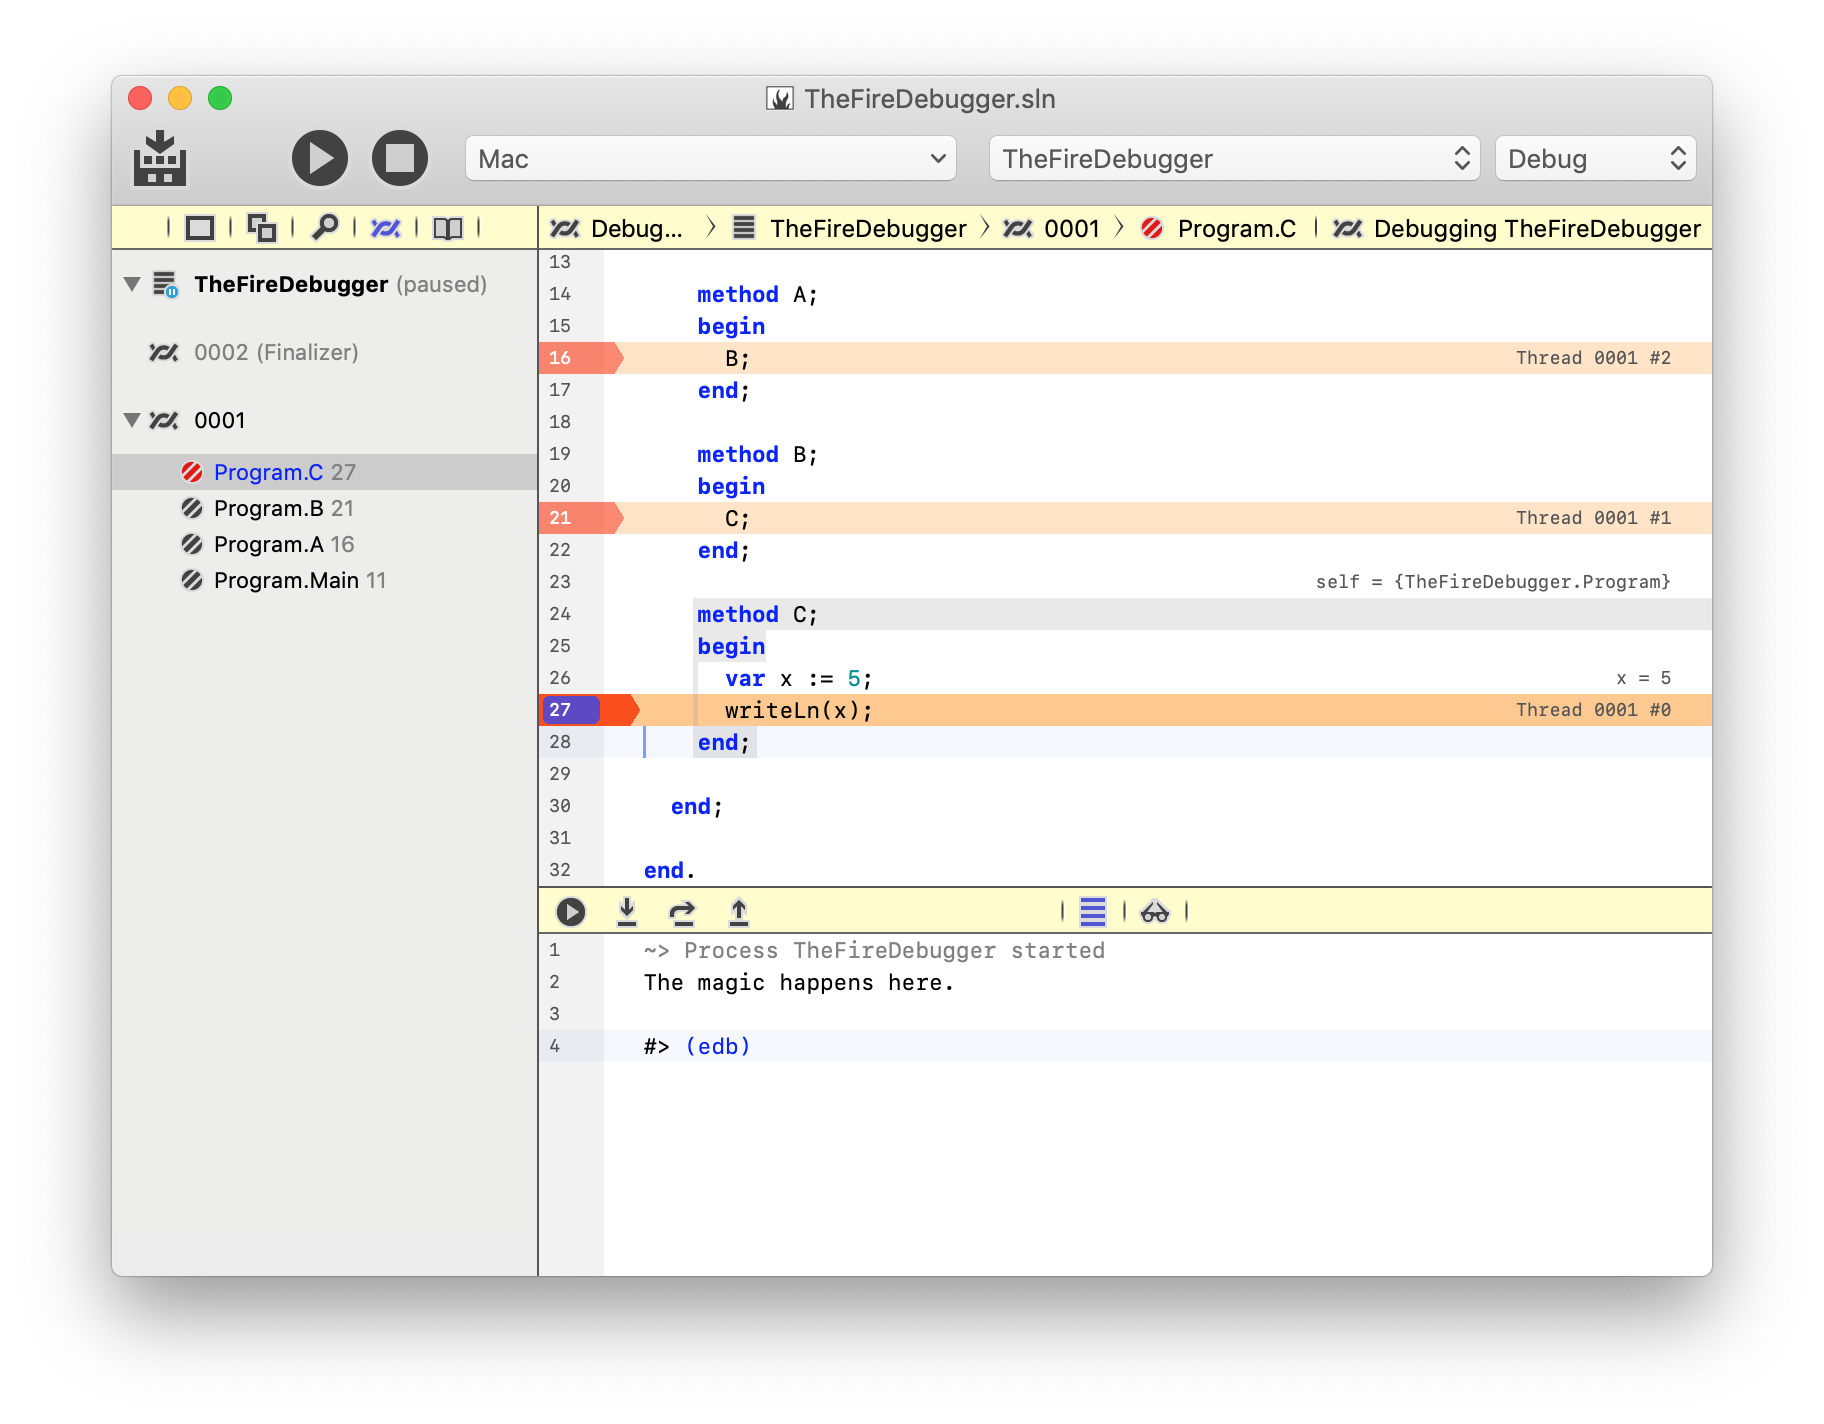
DebugPane
The Debug Pane can optionally be shown at the bottom of the Fire/Water user interface.
It can be opened and closed using the ⌘⇧Y or Ctrl+Shift+Y keyboard shortcut, or via the ""View|Show/Hide Debug Pane" menu.
Depending on the Platform of the current Debug Session, it consists of either two or three tabs, which can be toggled between with the buttons at the center of its toolbar, or via the ⌘⇧1, ⌘⇧2, ⌘⇧2 or Ctrl+Shift+1, Ctrl+Shift+2, Ctrl+Shift+3 keyboard shortcuts.
- The Debug Console
- The Debug Inspector
- The Device Log ("logcat", Android only)
On the left hand side, the toolbar also provides buttons to Pause, Step or Continue the current debug session or (when no session is running) to start a fresh debug session for the active project:
Just like the Jump Bar at the top of the window, the Debug Pane's toolbar will show yellow when a debug session is active.