Execution Points
For each Stack Frame that is mapped to a source location, an Execution Point will be highlighted in the source code for the appropriate location.
Depending on the number of threads and the depth of the stack for each of them when your application is paused, there can be many active execution points, across multiple files and methods (and sometimes even within the same method, if recursion is involved).
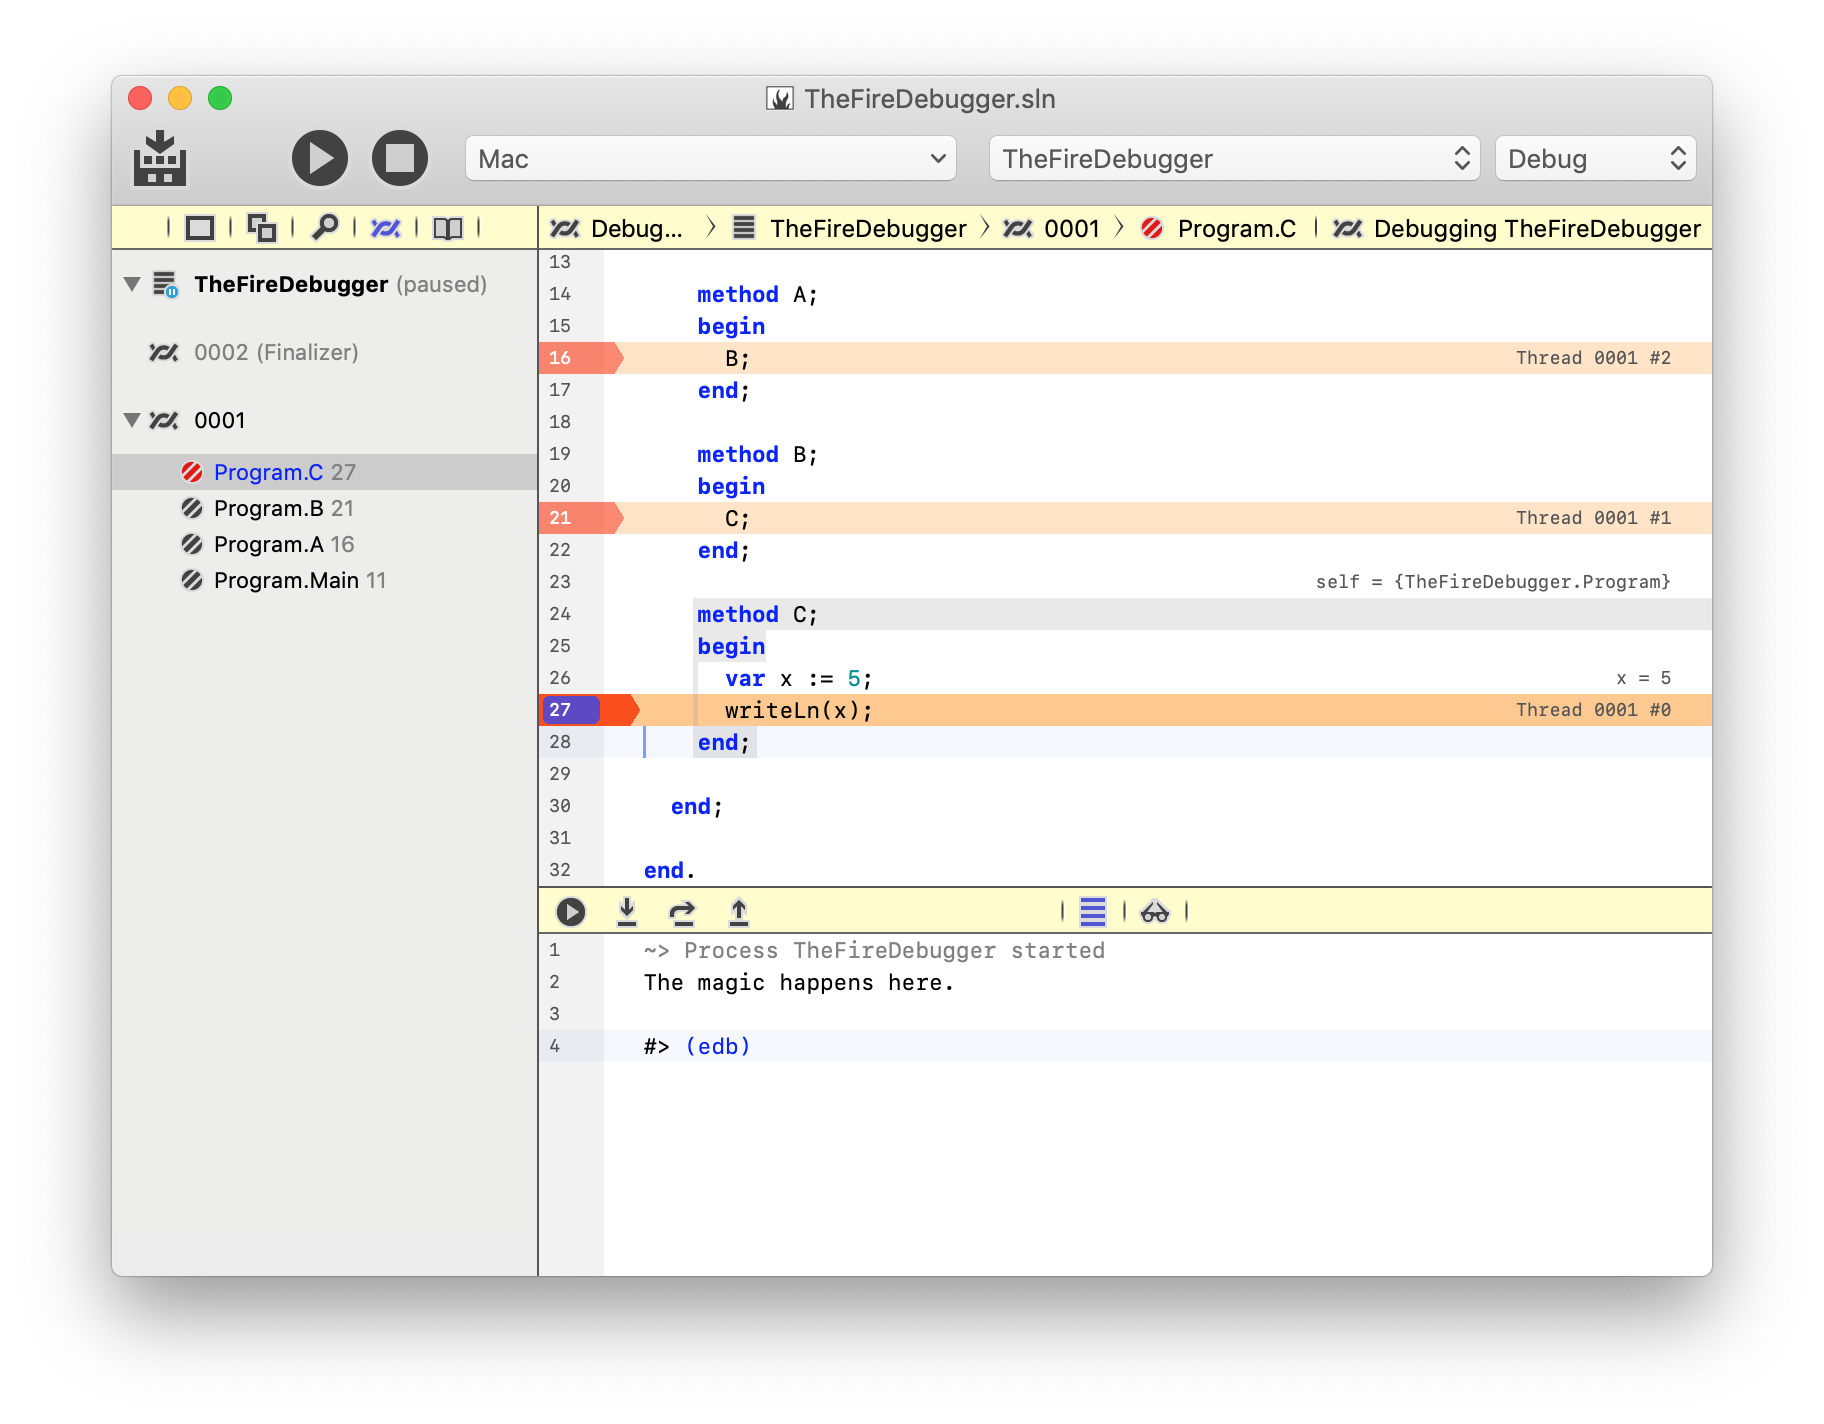
In the screenshot above, three execution points are visible (and a fourth is further up, off screen), one for each of the A, B and C methods you see in the Threads and Callstacks pane. Each execution point is marked by an orange highlight across the entire line and a darker arrow on the lefthand side by the line numbers. Also, room permitting, the ID of the Thread and the index of the stack frame will be drawn on the right (e.g. "Thread 0001 #0"). This allows you to easily see which thread each execution point belongs to, and their order.
In a paused Debug Session there is always exactly one current, active Stack Frame. The execution point of that stack frame is drawn in a deeper orange, and the editor will also try and draw inline evaluations for local variables declared around that execution point.
The active stack frame is also indicated by a red icon in the Threads and Callstacks pane, and you can change it simply by selecting a different stack frame in the tree.