Debugging in the Simulator
In addition to debugging on a real physical Device like an iPhone, iPad, iPod touch or Apple TV, you can also debug your iOS, tvOS and visionOS apps in a Simulator running on your Mac.
In this mode, a separate build of your app will be made that will run natively on your local computer. Debugging in the Simulator can be helpful for efficiency and speed reasons, but – for obvious reasons – does not give the fukll experience and fidelity as running on real hardware, which has different capabilities, sensors and performance characteristics.
Prepare for Debugging
On installation, Xcode will have created a bunch of pre-defined Simulators for various device and OS combinations. You can view, edit and add to these simulators in Xcode's Device Manager, available via ⌘⇧2:
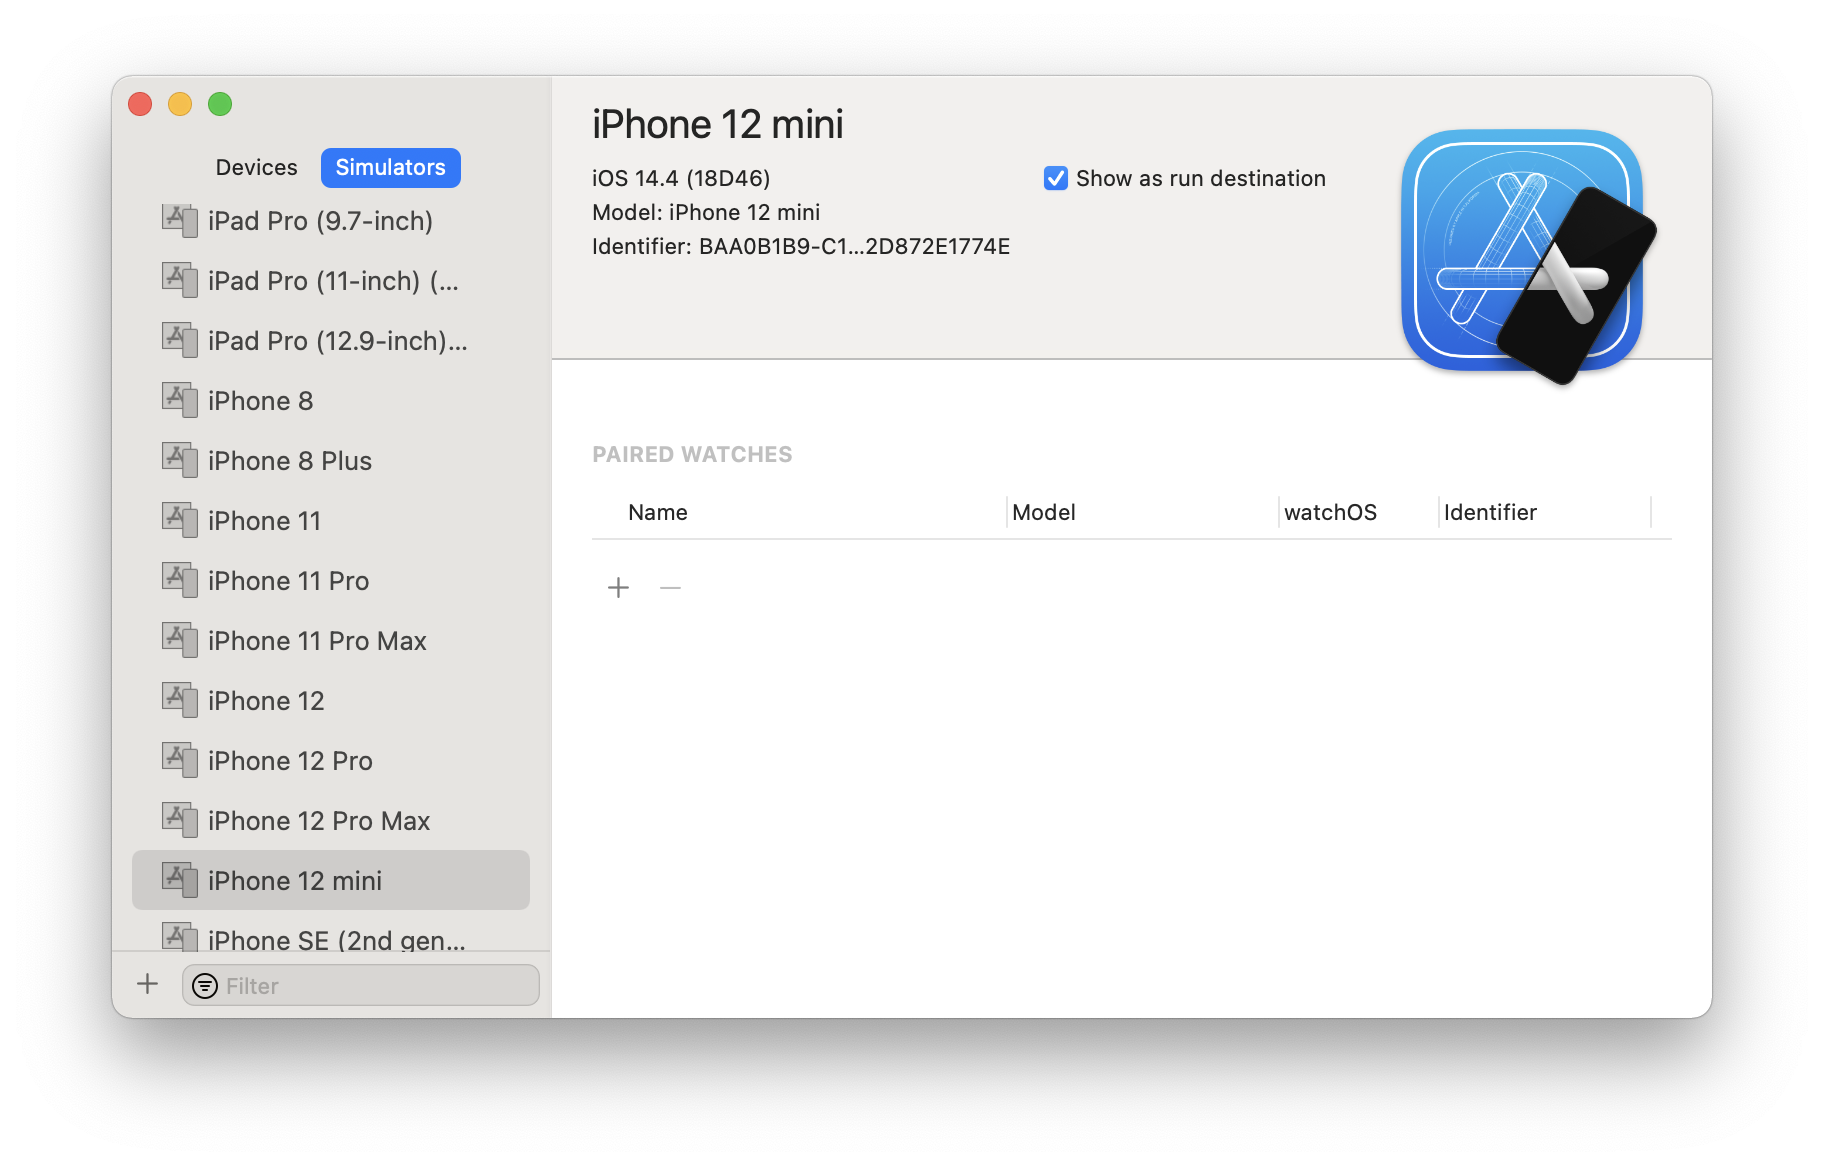
All these Simulators will automatically show in the CrossBox device picker in Fire. In Water or [Visual Studio](/Visual Studio), you must select (or newly connect to) a remote Mac, first.
Once done, simply select "Run" ("Start" in Visual Studio), or press ⌘R (Fire) or Ctrl+R (Water) or F5 (Visual Studio) to run your app. The IDE will automatically boot up the requested Simulator (of not already open from a previous run), install your app, and launch it.
When developing on Windows, your app will first be transferred to or updated on the remote Mac (parts may already be there from the build), as an intermediate step.
Troubleshooting
Just as when debugging on a Device, the Build Log in Fire and Water, will start to extend beyond the build itself, and update to show details about the boot process of the Simulator, deployment and launch of your application. This is a good place to look for more detailed information about what the problem is if deployment or launch of your app failed, of the Simulator fails to boot.