Using Instruments to Profile Mac and iOS Apps
One of the greatest tools in Apple's tool chain is the profiler.

Profiling is an essential debugging tool for every developer, whether you want to tune the performance of a particularly time-sensitive piece of code, or drill into some memory issues (be it leaks or general memory load). With ARC, just like with Garbage Collection on .NET or Java, regular object leaks are rare, but one scenario where they can still happen (opposed to GC) is with so-called Retain Cycles — where object A holds on to object B, and vice versa.
Because Instruments is such an essential tool for the Cocoa developer, we have deeply integrated support for it into the Oxygene tool chain as well, and I'd like to demonstrate that in a quick (only somewhat contrived) sample.
Let's say you have the following code:
type
  DummyData = class
  private
    fData: NSMutableArray;
  public
    method init: id; override;
    method Work; empty;
  end;

  DummyDataItem = class
  private
    fOwner: DummyData;
  public
    property owner: DummyData read fOwner;
    method initWithOwner(aOwner: DummyData): id;
  end;

implementation

method DummyData.init: id;
begin
  self := inherited init;
  if assigned(self) then begin
    fData := new NSMutableArray;
    for i: Int32 := 0 to 1000 do
      fData.addObject(new DummyDataItem withOwner(self));
  end;
  result := self;
end;

method DummyDataItem.initWithOwner(aOwner: DummyData): id;
begin
  self := inherited init;
  if assigned(self) then begin
    fOwner := aOwner;
  end;
  result := self;
end;
public class DummyData
{
    private NSMutableArray fData;

    public override id init()
    {
        this = base.init();
        if (this != null)
        {
            fData = new NSMutableArray();
            for (int i = 0; i < 1000; i++)
                fData.addObject(new DummyDataItem withOwner(this));
        }
        return this;
    }

    public void Work() {}
}

public class DummyDataItem
{
    DummyData fOwner;

    public DummyData owner { get { fOwner } }
    public id initWithOwner(DummyData aOwner)
    {
        this = base.init();
        if (this != nil)
        {
            fOwner = aOwner;
        }
        return this;
    }
}
public class DummyData {
    private var fData: NSMutableArray!

    init() {
        fData = NSMutableArray()
        for var iL Int = 0; i < 1000; i++ {
            fData.addObject(DummyDataItem(owner: self))
        }
    }

    public func Work() {
    }
}

public class DummyDataItem {
    private var fOwner: DummyData;

    public var owner:DummyData {
        return fOwner
    }

    init(owner: DummyData) {
        fOwner = aOwner;
    }
}
Looks innocent enough. DummyData holds an array of
DummyDataItems it initializes on creation; the code (naïvely) assumes
the array and everything else to be released when the DummyData object
itself goes out of scope.
Except it doesn't, and your customer calls to complain that the app's memory footprint is growing. How do you find out what's going on? Instruments to the rescue.
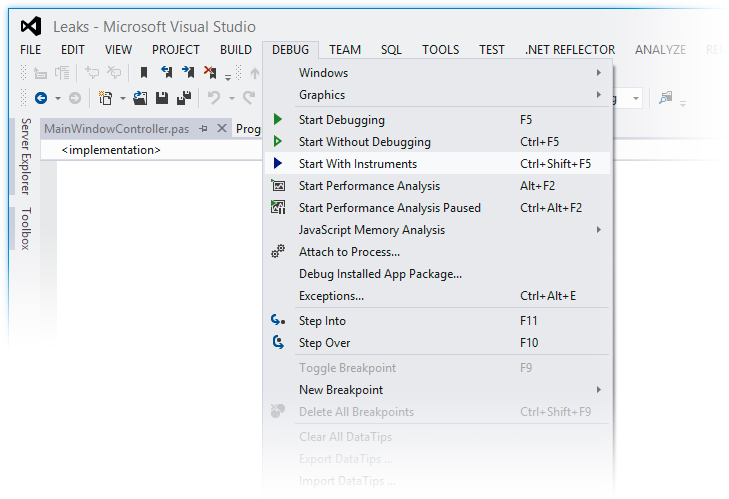
In Elements for Cocoa, Instruments is available right from inside Visual Studio and Fire. We've added a new menu item to the "Debug" menu (and you can also add it to the toolbar of course): "Start With Instruments" (Visual Studio) and "Run w/ Instruments" (Fire):
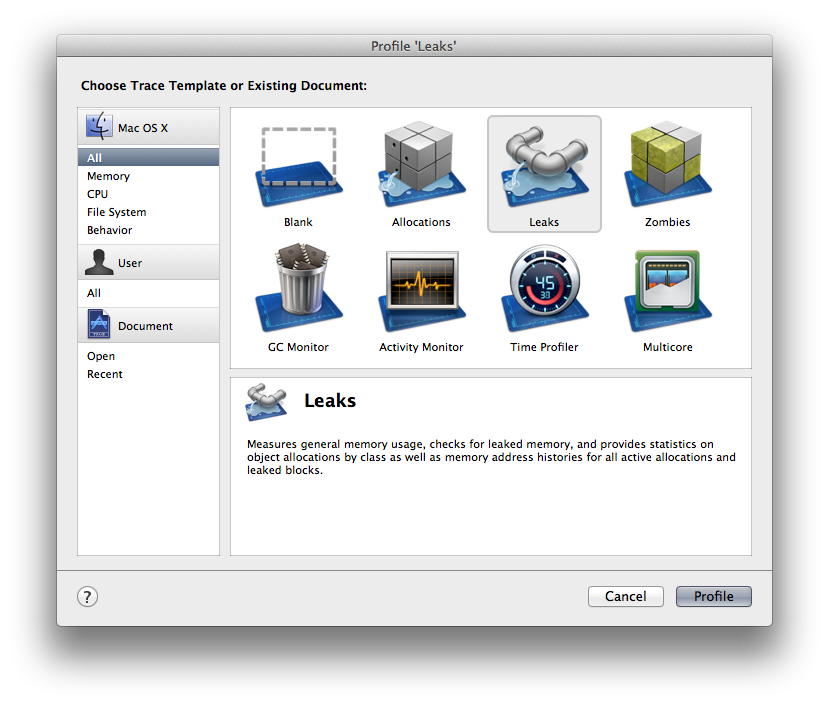
Hit that and Elements will build your app (if necessary), and via the magic of CrossBox, you'll see Instruments popping up, Mac side — by default asking you what kind of analysis you want to perform:
Select "Leaks" and that will open an Instruments document, and also start your application running. Play around with the app and trigger the code paths that lead to the memory increase. In the Instruments window, you san see what's happening, live — the overall memory load of the app keeps increasing (as shown in the "Allocations" instrument):
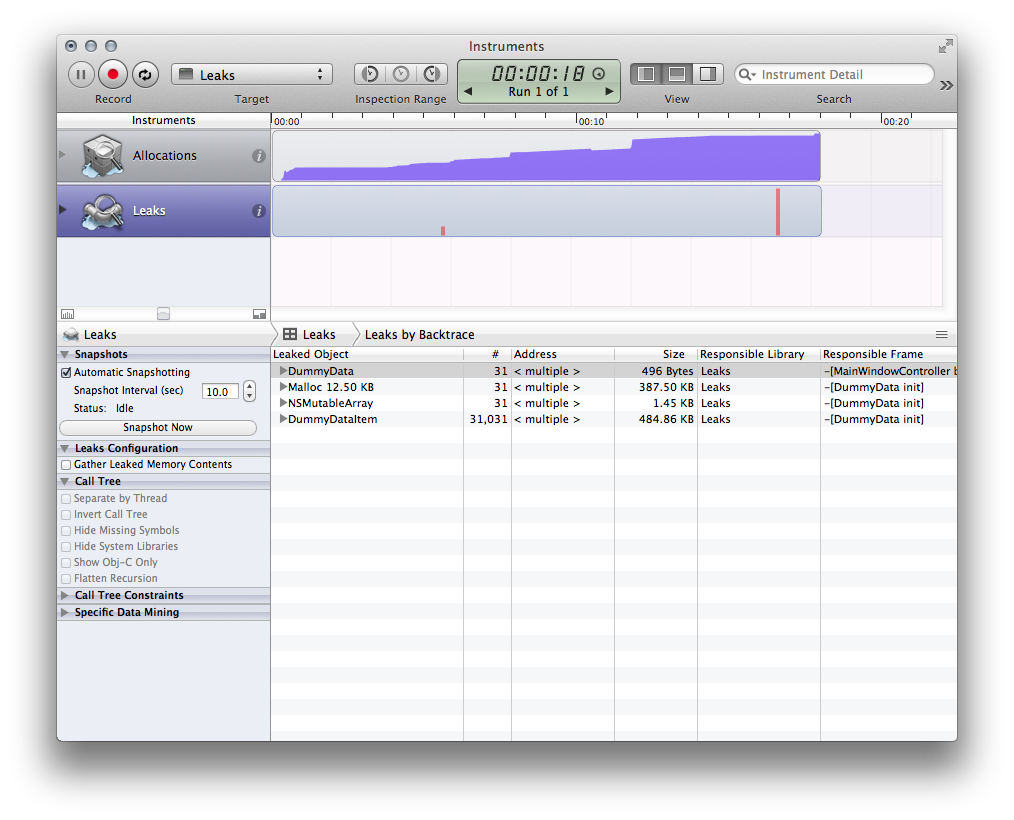
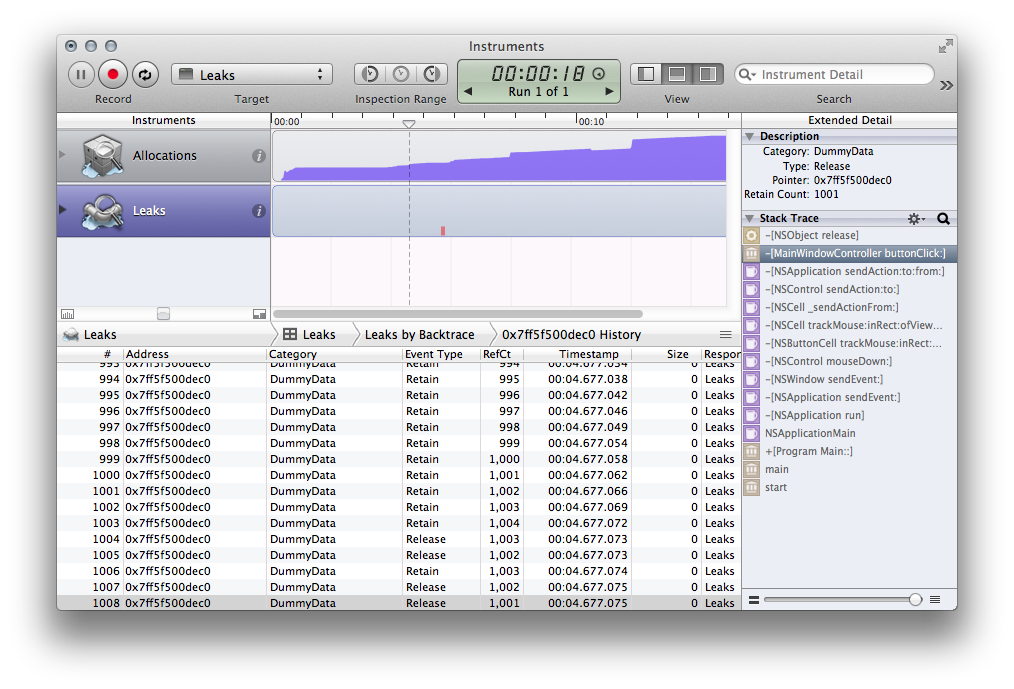
Quitting the app and selecting the "Leaks" instrument shows all the memory that was leaked — that is, not properly released. The picture is quite clear — it seems that 31 DummyData instances were created and never properly released. What's up with that? After all, your code that creates DummyData is dead simple:
method MainWindowController.buttonClick(aSender: id);
begin
  var d := new DummyData();
  d.Work();
end;
void buttonClick(id sender) {
  DummyData d = new DummyData();
  d.Work();
}
func buttonClick(sender: Any?) {
  let d = DummyData()
  d.Work()
}
d goes out of scope right after it's used, and that should release the
object, right?
Fold open one of the DummyData items in the list and click on the little
arrow next to its address to drill into its retain/release history.
You'll see a huge list of roughly a thousand calls to retain. The call
stack on the right tells you these happen from within
DummyDataItem.initWithOwner:. That makes sense — your code creates a
thousand of them, after all.
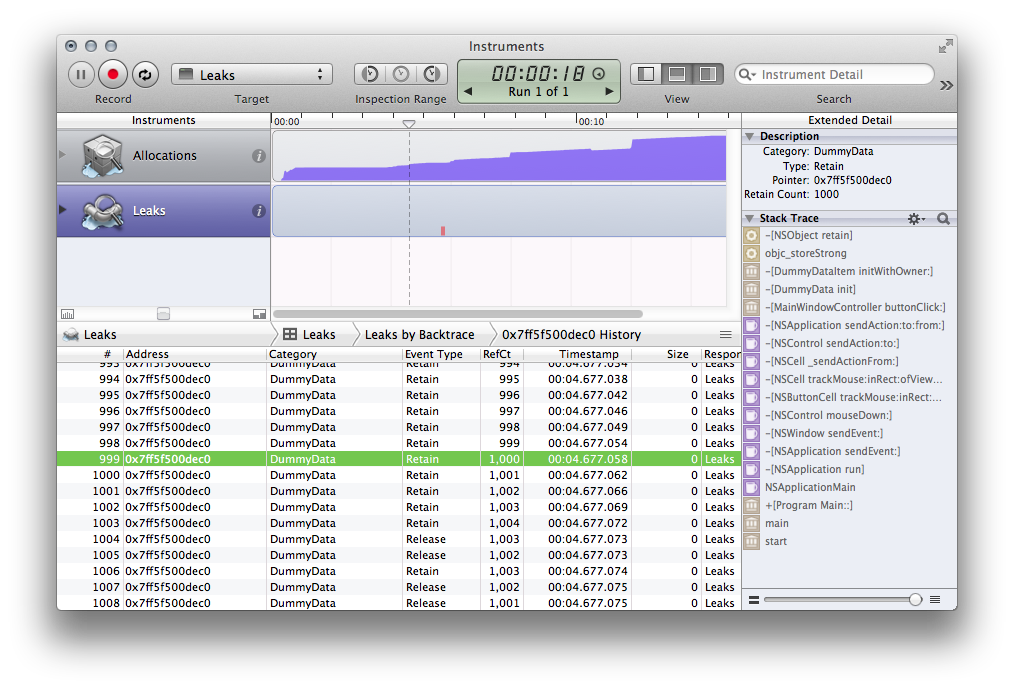
At the very end of the list, you see that from buttonClick your
DummyData is being released though.
What's going on? Shouldn't d going out of scope release the array,
which in turn releases the DummyDataItems, which in turn… wait, we're
getting close to the problem! It looks like our data structure contains
what is called a "retain cycle". The DummyData holds on to the NSArray,
which holds on to the DummyDataItems which, in turn, hold on to the
DummyData itself. Even though d is going out of scope, its retain
count is only going down to 1001, because all the DummyDataItems still
have references. As a result, the DummyData object actually never gets
freed, and neither does the NSArray or the DummyDataItems inside it,
which, in turn, can never give up their hold on the DummyData itself.
Though in this case we found the issue fairly quickly, Instruments has one more tool up its sleeve to make it even easier to find retain cycles: Click on the "Leaks" item in the navigation bar and select "Cycles & Roots":
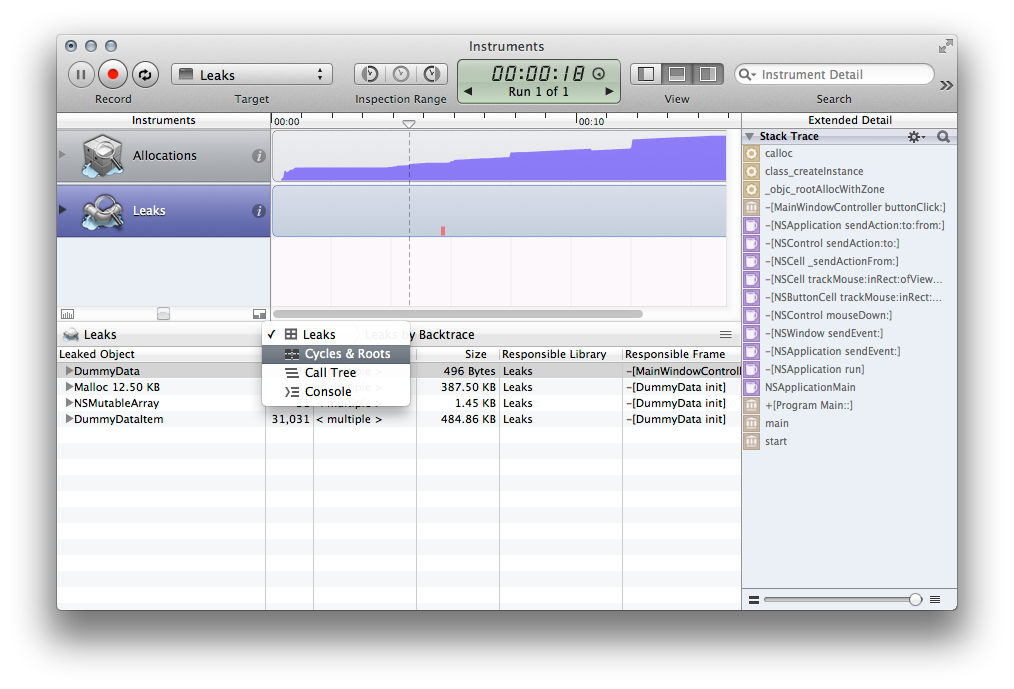
Instruments has actually detected any retain cycles for us and shows them in a list (in this case, 31 of the same), along with a nice graphical representation of what is going on.
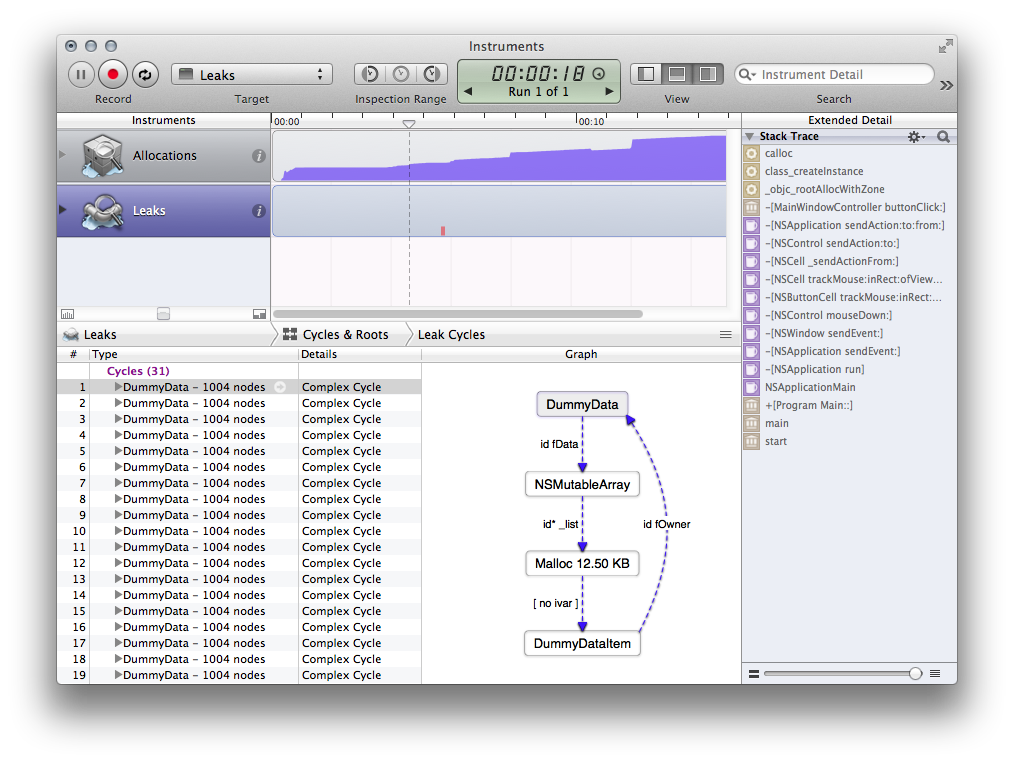
From this view (even without our previous investigation), it becomes immediately clear that the fOwner reference from DummyDataItem back to DummyData is the culprit.
How do you break this vicious circle (assuming you cannot simply drop the owner reference altogether)? Weak references to the rescue!
type
  DummyDataItem = class
  private
    fOwner: weak DummyData;
  …
public class DummyData
{
    private __weak NSMutableArray fData;
    …
public class DummyData
{
    weak var fData: NSMutableArray?
    …
By default, all variables and fields in Elements (and Objective-C with
ARC) are strong — that means when an object is stored in the
variable, its retain count is increased. By contrast, weak
references just store the object without affecting retain count. In
fact, they do one better: they also keep track of the referenced object
and automatically get set to nil when said object is released — so you
never have to worry about the variable pointing to a stale object (which
is a big problem in non-ARC languages).
Sidebar: A third type of object references are so-called unretained references.
These behave like regular pointers in old-school languages; they store
the object address, and when the object gets released, that address will
be stale — your code will be responsible for worrying about that.
With the code fixed, hit the "Start With Instruments" menu again. Your app will launch and Instruments will profile, and as you work with your app, you will notice that the memory load now stays down — as originally expected.
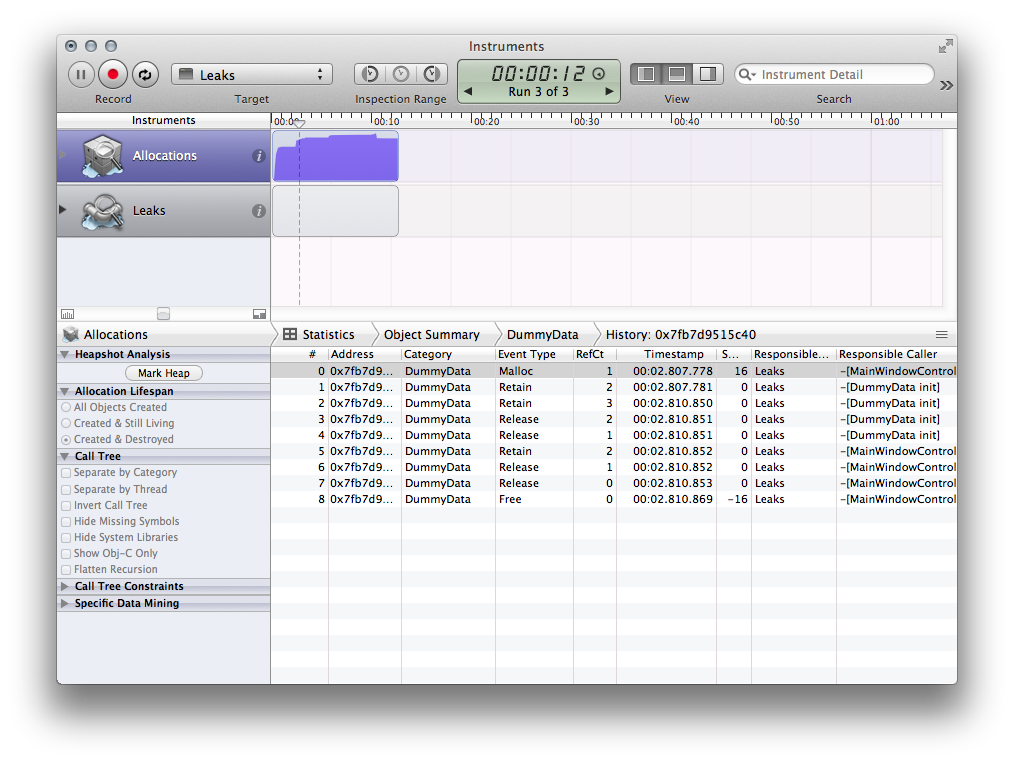
Of course, the Leaks pane will remain empty, but just to confirm, you
can select the "Allocations" instrument, select "Created & Destroyed" in
the sidebar and then locate and drill into one of the DummyData objects.
As you can see, the retain/release history is much more sane now — no
1000 extra retains from DummyDataItem — and the object actually was
released at the end of buttonClick.
Success!
Summary
We've had a quick look at how Instruments works and can be used to inspect
memory allocations (the first phase of the investigation above does not
just apply to bona-fide leaks and retain cycles, but can also be helpful
if you just want to get a general impression of what memory your app is
holding on to, and why), learned about retain cycles and the weak, 'strongandunretained` Storage Modifiers, and we have also seen
how Instruments can be used from Elements.