Debugging on an iOS, tvOS or visionOS Device
You can debug your iOS, tvOS and visionOS projects directly on device, running as they would for your users, with a device that is connected to your Mac by USB or WiFi.
Prepare for Debugging
There are a few things that might need to get set up before you first develop on a particular device.
Trust the device
When a device is first connected to a Mac, it restricts what the Mac can do via USB, until you trust it. Your iOS or watchOS device will show a message asking you whether you want it to trust the connected computer, and only after you confirm can the device be used for debugging (and most other tasks you would want to do when connected).
Getting Device Support
iOS, tvOS, visionOS and watchOS Devices often run slightly different versions of the operating system than Xcode ships support for.
When you first start working with a device, or if you updated to a new version or a new beta of the Operating System (even a minor new version, such as from 14.4 to 14.4.1), you should launch Xcode, open the Device Manager (⌘⇧2) and let Xcode download support files for the exact version of the OS you are running.
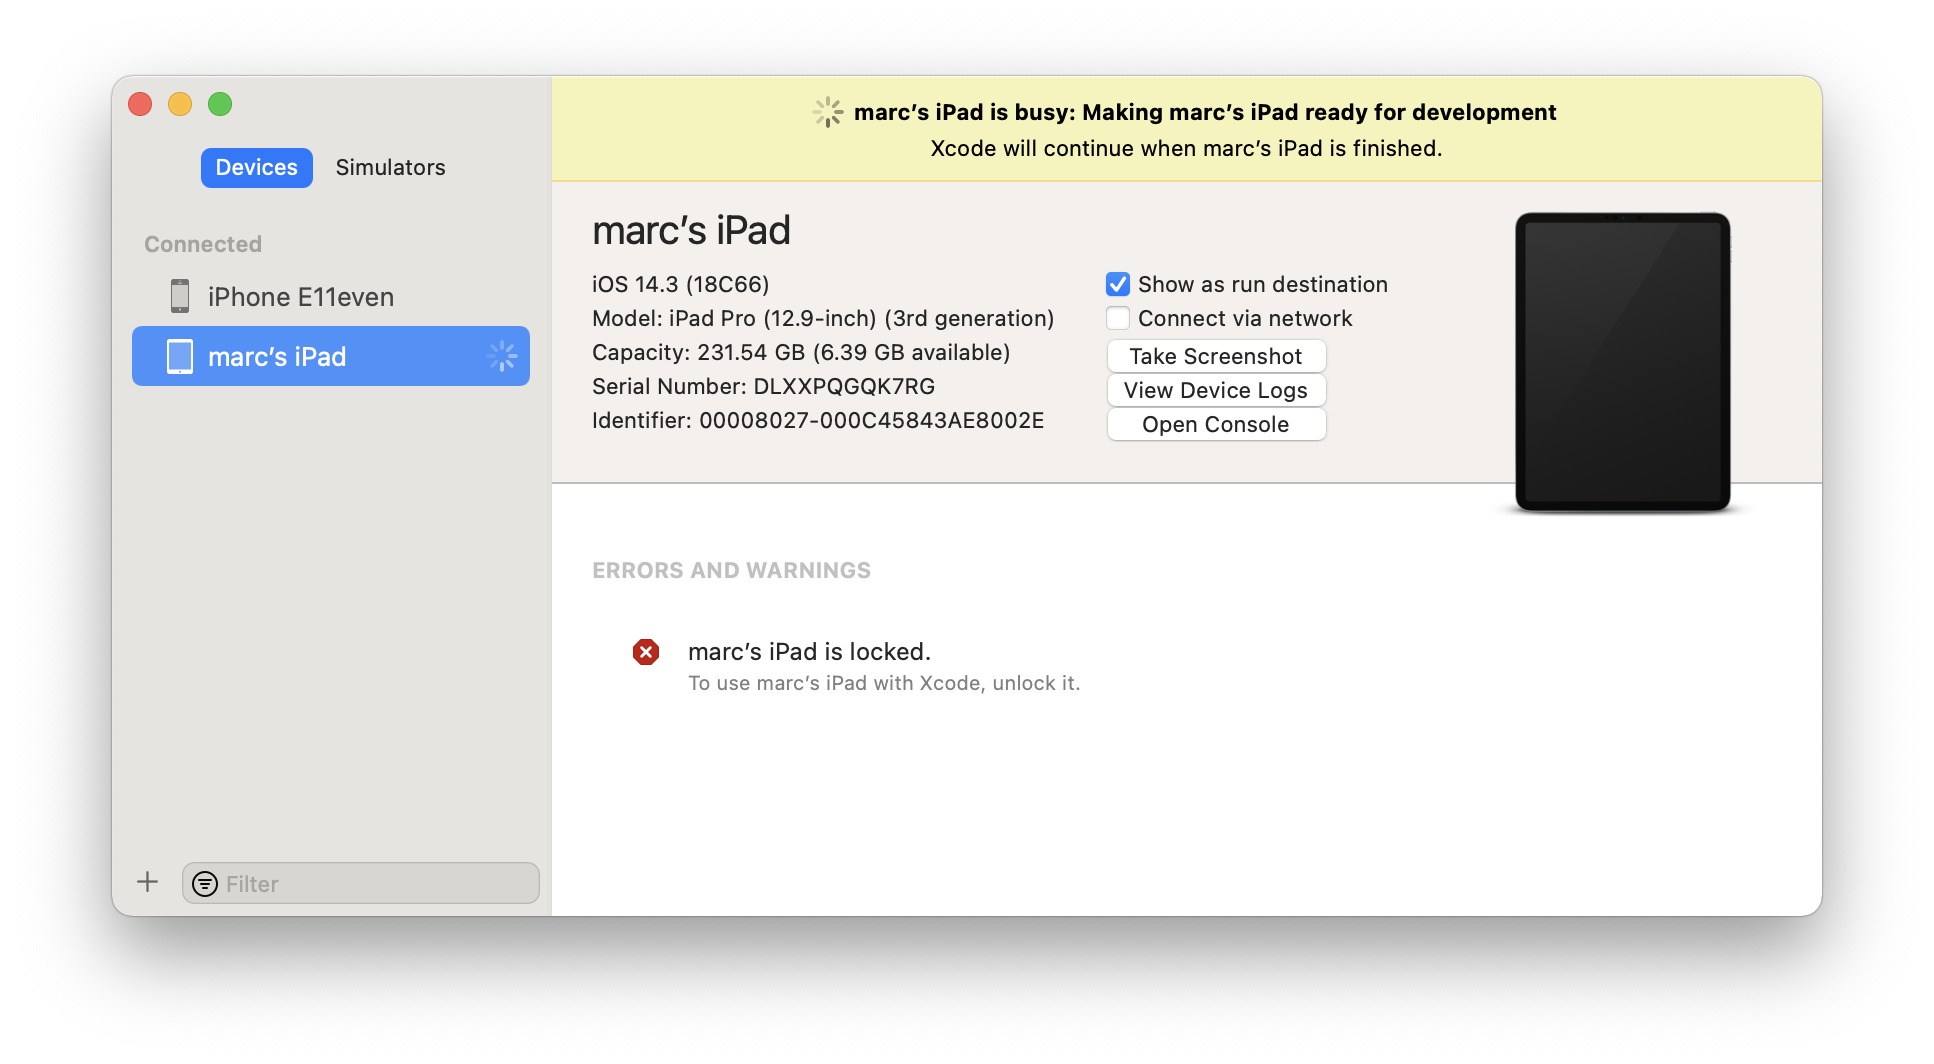
Only after the yellow bar at the top of device manager disappears can will you get the full debugging experience. Without this step, you will be able to run your apps, but you might get incorrect stack traces, as the debugger can not resolve symbols for the OS binaries on device.
Allow WiFi Debugging
On this same screen you can also enable your device for debugging via WiFi, without USB cable connection to your mac, by checking the "Connect via Network" option.
Once checked, you can unplug your device, and it will still remain available for debugging.
Do note that tom preserve battery, your debice will not remain connected to your Mac indefinitely if your devices screen turns off or your device goes out of range of the Mac for a prolonged period of time, you will see it disappear from the CrossBiox device picker in the IDEs (or show as "(not connected)", if it is selected as the active device for tour project.
Usually, just turning the device back on and unlocking it close to your Mac should make it reconnect; if that fails quickly connecting it via USB for a few moments should do the trick.
Project Requirements
While you can run any code you like on your Mac or in the Simulator, deploying apps to your device requires a proper Provisioning Profile and Code Signing Certificate set up for your project. Please refer to the two before-linked topics for details.
Note that profiles and certificates differ between those used for debugging (or simply side-loading onto device_ and deployment (whether via the App Store, TestFlight or otherwise).
It is common to set your "Release" configuration to use your deployment profile and certificate, and the "Debug" configuration to se the debug ones – but these configurations are convention, you can name or set this up differently, if you prefer.
Let's Debug
With these things our of the way, you are ready to debug your project. Simply select the device yu want to debug on from the CrossBox menu and select "Run" fromm the "Debug" menu in Fire or Water (⌘R or Ctrl+R), or press "Start" in Visual Studio (F5).
Your project will be built (if needed), and deployed to your device. If you are working from Windows, it will be uploaded to the Mac, as an intermediate step.
Read more about:
- Deploying from Fire and Water
- Debugging in Fire and Water, in general
- Debugging in Visual Studio, in general
Troubleshooting
in Fire and Water, the Build Log will start to extend beyond the build itself, and update to show details about the deployment and launch of your application. This is a good place to look for more detailed information about what the problem is if deployment or launch of your app failed.
Common scenarios are
-
Your device got locked while building or deploying (or you never unlocked it); simply unlock it, run again, and maybe keep a finger on the screen to keep it from locking.
-
Your Provisioning Profile and/or Certificate do not match, do not contain your device, or you are using the wrong (e.g. deployment) versions.