Profiler
Elements, as of Version 10, includes a cross-platform Instrumenting Performance Profiler that can be used on all platfroms to find bottlenecks and get an overall understanding of where your application or parts of your application spend the most processing time.
The profiler is a combination of an Aspect that instruments your code, a cross-platform library that links into your application to gather data, and IDE-integrated tools that let you evaluate the results.
Profiling can be enabled with a few simple steps:
- Add the profiler library for your platform to your app as reference.
- Add the profiler aspect Cirrus Reference to your project.
- Annotate the class or classes you want to profile with the
ProfileAspect. - Add the
PROFILEConditional Define. - (Re-)Build and run your app.
Both Fire and Water include a new Profiler view (available via "Debug|Show Profiler" and from the Jump Bar) that automatically loads in the results and presents them visually, after your app finished running.
As you tweak your code and run again and again, the profiler view updates with the latest results.
Let's look at these steps in more detail.
1. Adding the Profiler Library
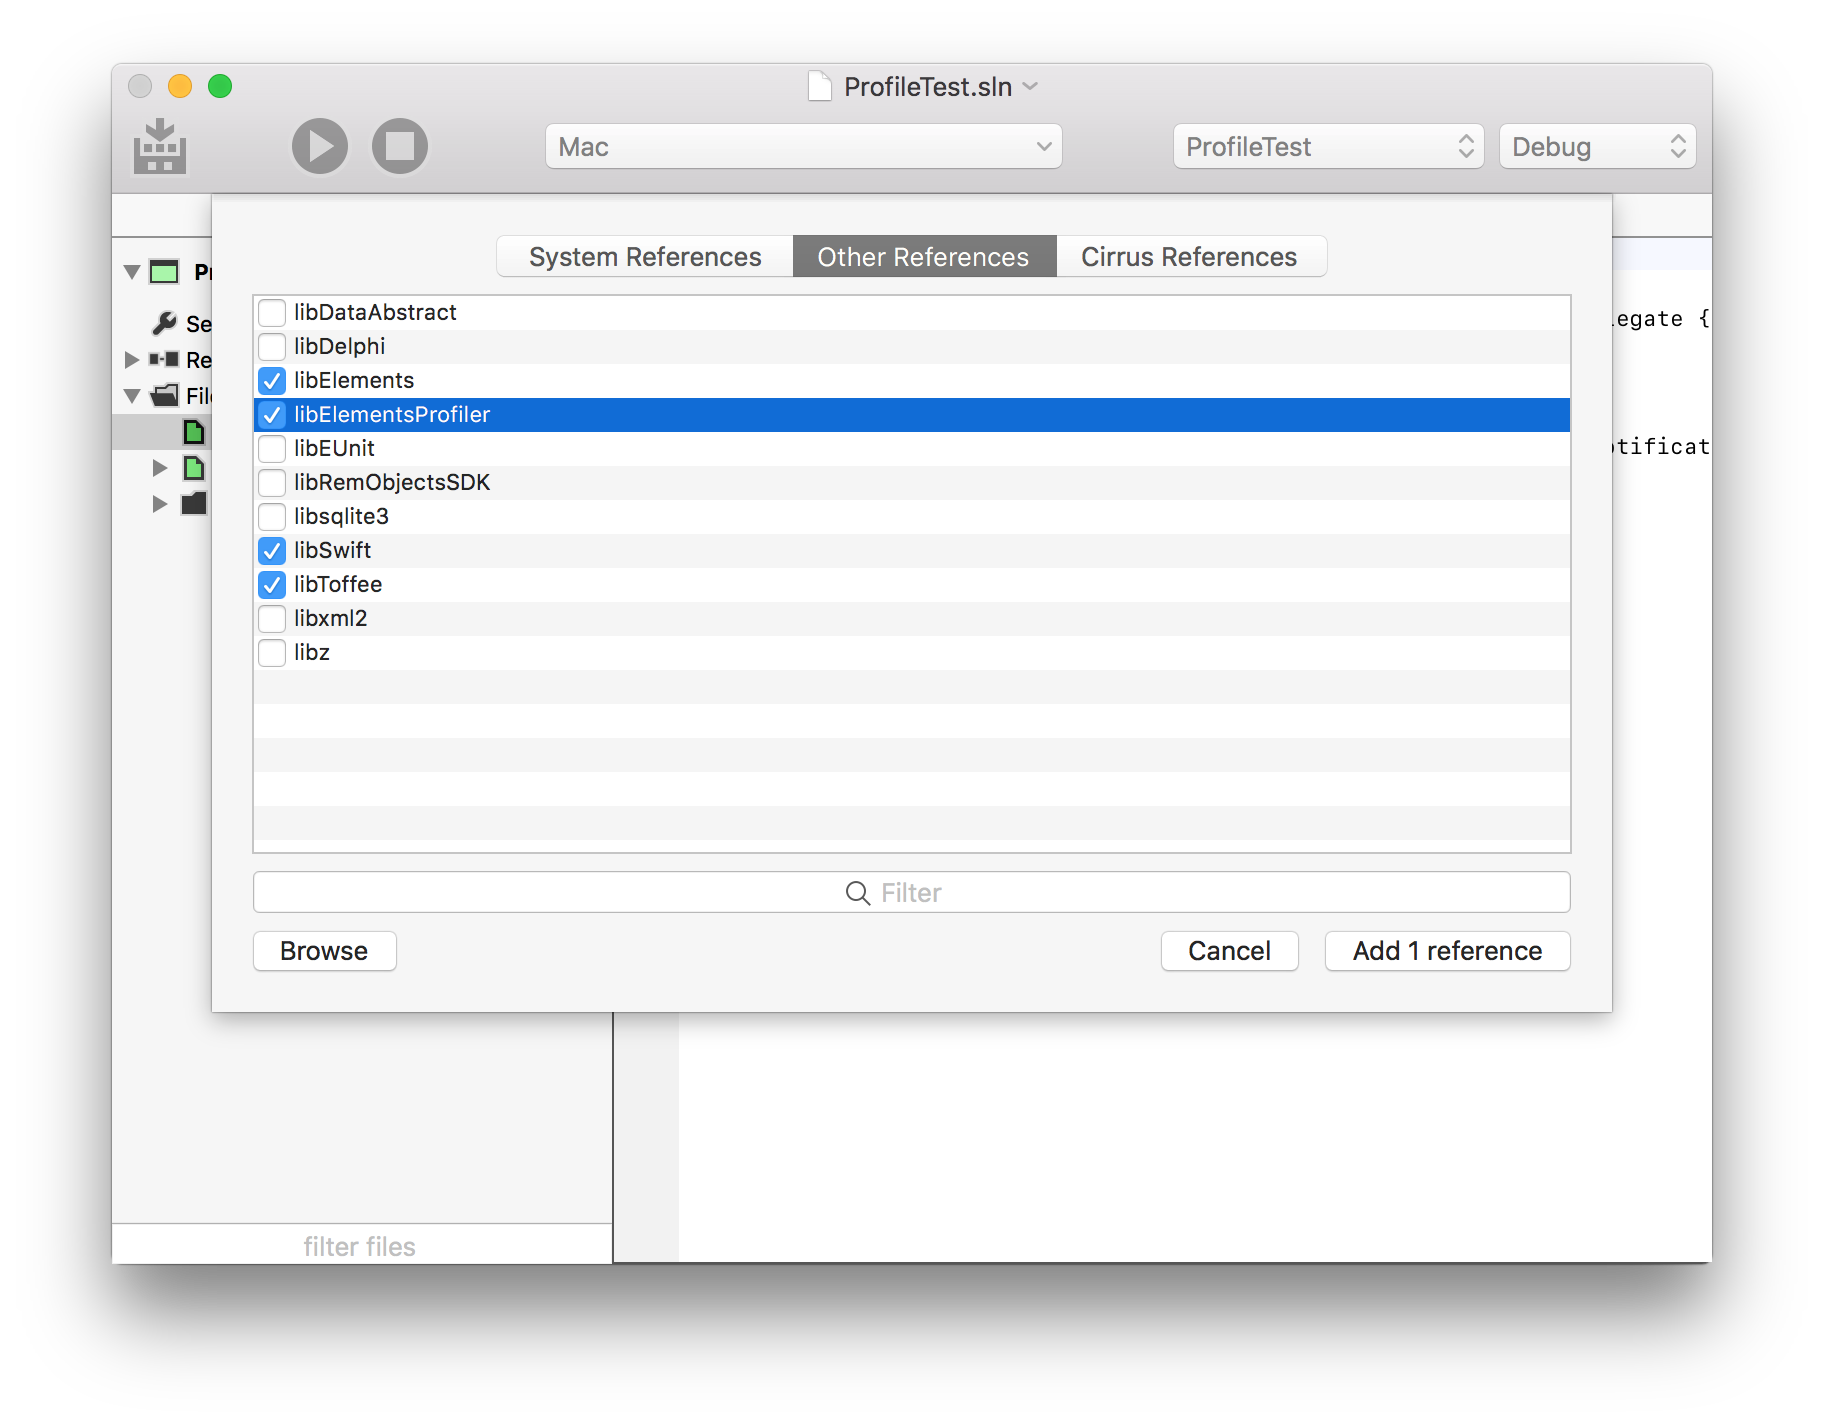
Adding a reference to the profiler library is as easy as opening the "Manage References" sheet (from the "Project" menu, or via ^⇧R in Fire or Alt-Shift-R in Water), selecting the "Other References" tab, and picking the right reference, depending on your platform:
- RemObjects.Elements.Profiler.dll for .NET
- remobjects.elements.profiler.jar for Java
- libElementsProfiler.fx for Cocoa
- ElementsProfiler.fx for Island
3. Annotate your Classes
Next, choose the classes you want to profile, and mark them with the RemObjects.Elements.Profiler.Profile aspect. You can mark as few or as many classes as you want, but you will get best results if you keep profiling focused on a specific area of interest. For example, if loading of documents in your app is slow, annotate the classes that deal with that area of code, but not the rest:
uses
  RemObjects.Elements.Profiler;

type
  [Profile]
  MyDocument = public class
    ...
  end;
using RemObjects.Elements.Profiler;

[Profile]
public class MyDocument
{
    ...
}
import RemObjects.Elements.Profiler

@Profile
public class MyDocument {
    ...
}
import RemObjects.Elements.Profiler.*

@Profile
public class MyDocument
{
    ...
}
By default, any class marked with [Profile] (Oxygene and C#) @Profile (Swift and Java) or <Profile> (Mercury) will be profiled. But if you want to keep different sets of profiling annotations in place, you can amend the aspect with the name with an optional conditional define that needs to be present for profiling on that class to become effective.
E.g. [Profile("PROFILE_DOCUMENT_LOAD")] vs. [Profile("PROFILE_BUSINESS_LOGIC")].
4. Add the PROFILE Define
Your code is now almost ready to profile, but if you run your app, you will see no change yet. That is because the Profiler aspect takes no effect unless PROFILE is defined as Conditional Define in your project.
This is done so that you can easily enable and disable profiling without having to keep adding and removing annotations from your code. When you're done profiling, simply remove the define and rebuild, and the aspect will have no effect – no instrumentation will be added to your code, and you will have absolutely zero run-time overhead.
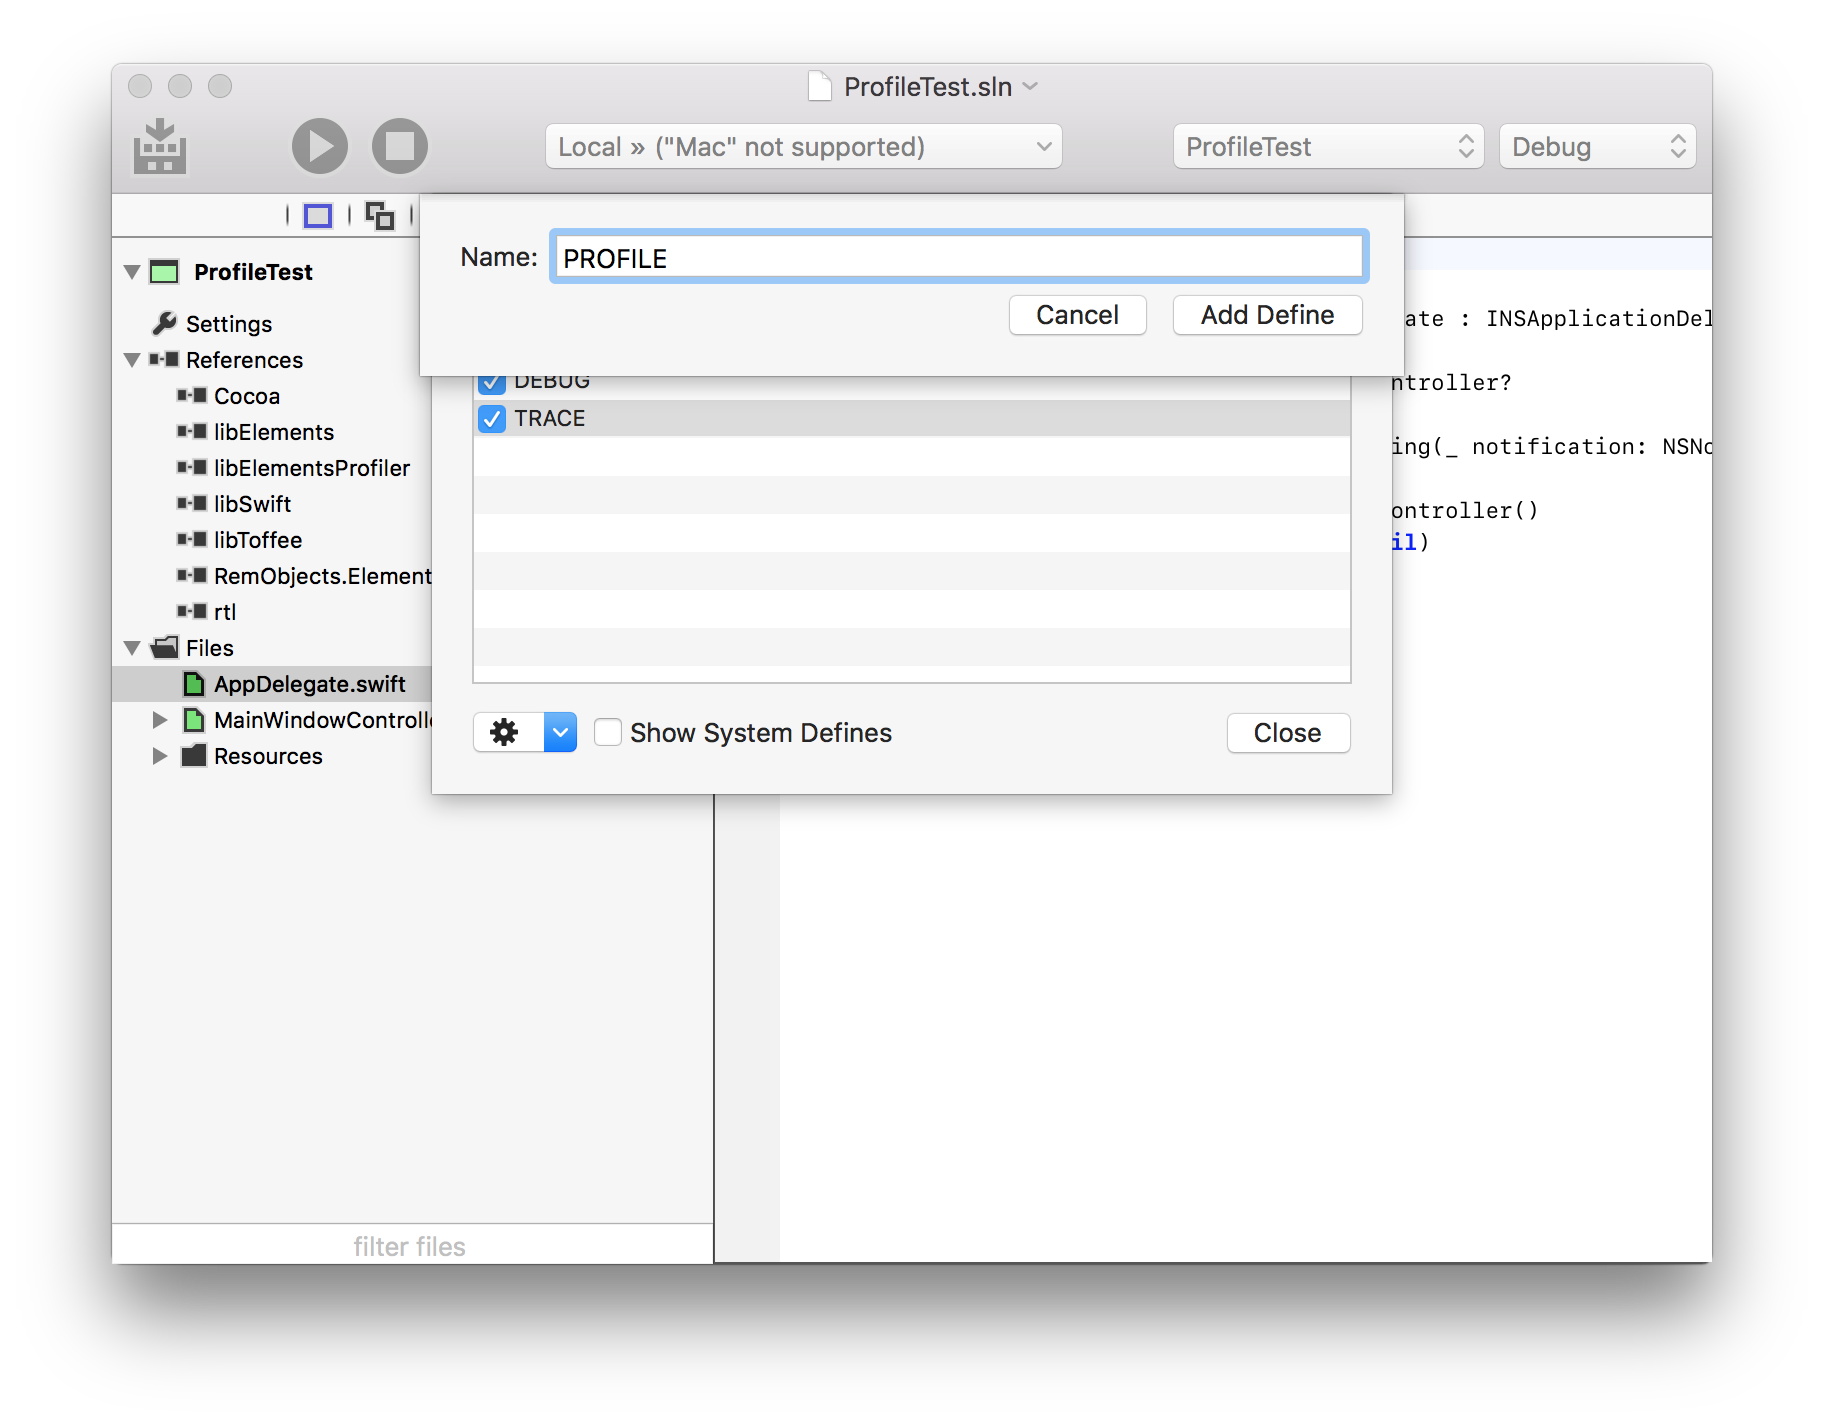
To add the define, open the "Manage Conditional Defines" sheet (again via the "Project" menu, or or via ^⇧D in Fire or Alt-Shift-D in Water), choose "Add" and type in PROFILE as the name of the new define. You can also simply copy the string PROFILE from here, and press ⌘V (Fire) or Ctrl-V (Water) to paste it in as new define.
4. Rebuild and Run Your App
You can now simply run your app, via "Project|Run" or ⌘R (Fire) or Ctrl-R (Water). Exercise the app as you normally would, to hit the code paths you want to profile (e.g. because they are slow). When you're done, simply quit your app naturally.
The IDE will automatically pick up the profiling results, and you can view them by choosing "Debug|Show Profiler" from the menu, or by choosing the "Profiler" item in the jump bar at the left-most level. (If the Profiler View is already visible, it will automatically update to the latest results.)
Analyzing the Results
The Profiler View consists of two panes.
The top pane shows you a list of all methods that have been marked for profiling and have been hit as part of your projects run. You can sort the list by various values, and you can also choose to either show all calls or filter down to a single thread.
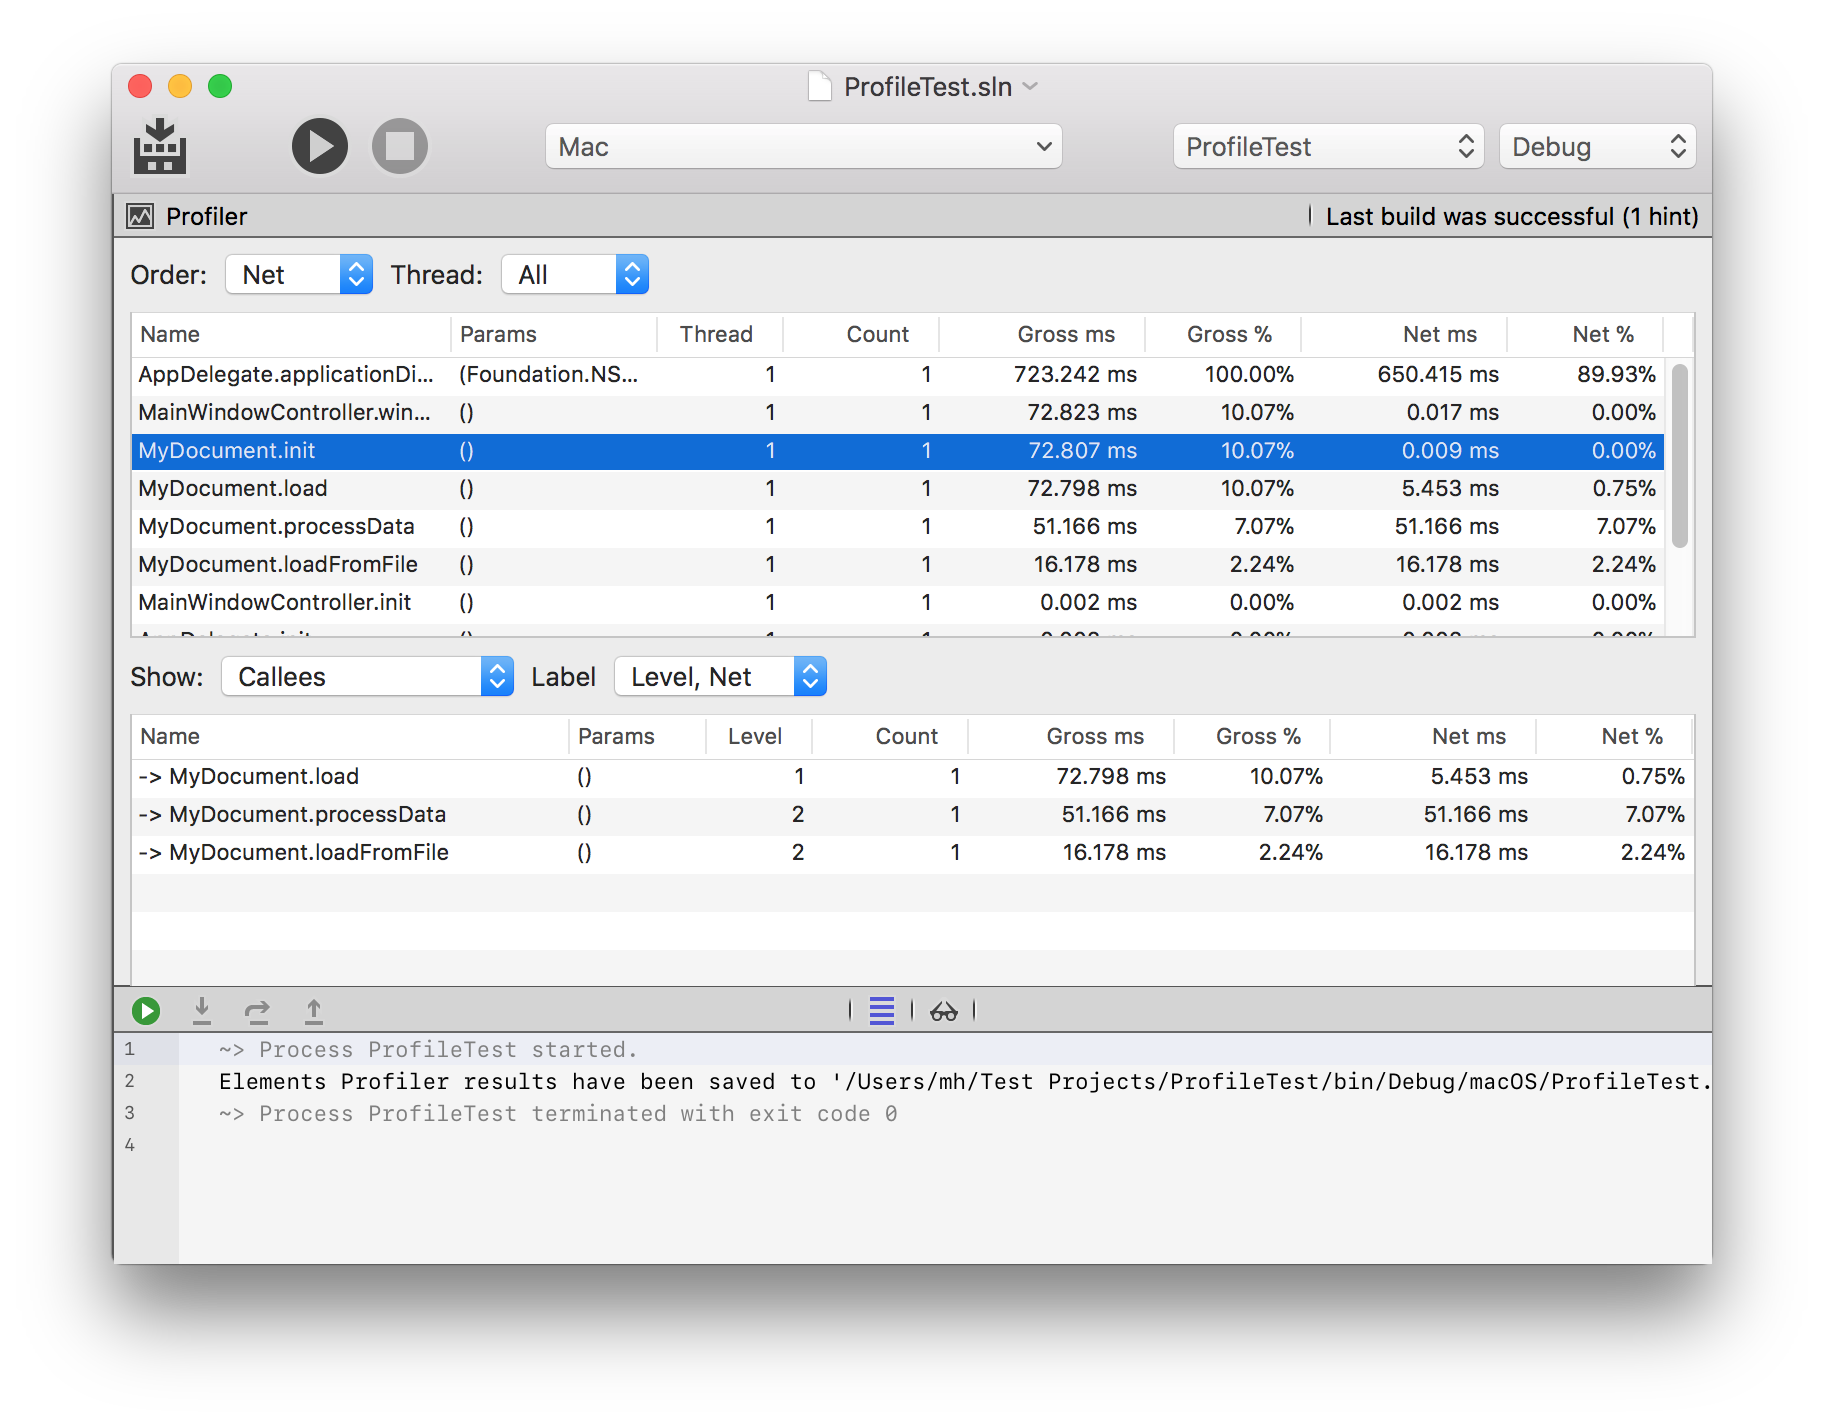
In addition to the name and parameters, for each method you will see how often it was called, as well has how much time it took to execute (all executions combined). The Gross time is the full time the method took to run, from start to finish; the Net time will exclude any time spent in (profiled) sub-calls.
For example, if you have a method Load() that delegates work to LoadFromFile() and ProcessData(), then the Gross time includes the entire duration of Load, including the actual load and the processing. The Net time shows only the time spent in Load() itself (or any calls that the profiler does not see because they are not instrumented), and excludes the time spent in LoadFromFile() and ProcessData().
In other words, the Gross time gives you the total that a specific task took, while the Net tells you how much time was spent at this level, opposed to deeper in the call hierarchy. If Net time is very small, you know the bulk of the work happened in child calls, and you can focus your investigation there; if Net time is relatively large, you know the most processing happened in that method (or in calls you have not profiled).
As you select a method in the top pane, the bottom pane will adjust to show you all the child methods called from this method, as well as (optionally) all the methods that called into it (you can toggle which ones to show via the "Show" popup button).
For these callees or callers, you too will see the Net and Gross time.
Double-clicking a method in the bottom view will activate it in the top (showing its callees and/or callers, in turn) – allowing you to quickly drill in and out of call hierarchies.
Supported Platforms
While profiling is supported on all platforms, technically, some deployment targets (such as iOS, watchOS, tvOS or Android devices) don't have a good way to provide the results back to the IDE. Currently, gathering profiling results is supported for
- .NET
- Plain Java
- macOS (in Fire)
- iOS Simulator (in Fire)
- Island/Windows (in Water)
- Island/Linux (in Water, when running in local Bash for Windows)
Automatically gathering profiling results is not supported when running on devices, or when running on a remote CrossBox server.